Identifying samples and mixtures
In OMNIC Paradigm software, you can identify samples and mixtures by using correlation and multi-component searches. In these types of analyses, the spectrum of your sample is compared to spectra stored in libraries and the software finds the best matches. In a correlation search, each result is a single compound and in a multi-component search, each result shows several compounds that contribute to the overall composite spectrum.
Identifying samples and mixtures
To identify samples and mixtures, measure your sample as usual. In the Spectra view, go to the Identify menu and select either Correlation search to find a single match or Multi-Component Search to identify composite matches and their contributing compounds.
Search setup
Configure settings for correlation search and multi-component search using Search Setup. These settings are used automatically when you select Correlation Search or Multi-component Search from the Identify menu in the desktop interface or from the main menu in the touchscreen interface.
Using the desktop interface, you can also use Search Setup to specify the location of additional libraries on your system. See "Add Library Locations" for details.
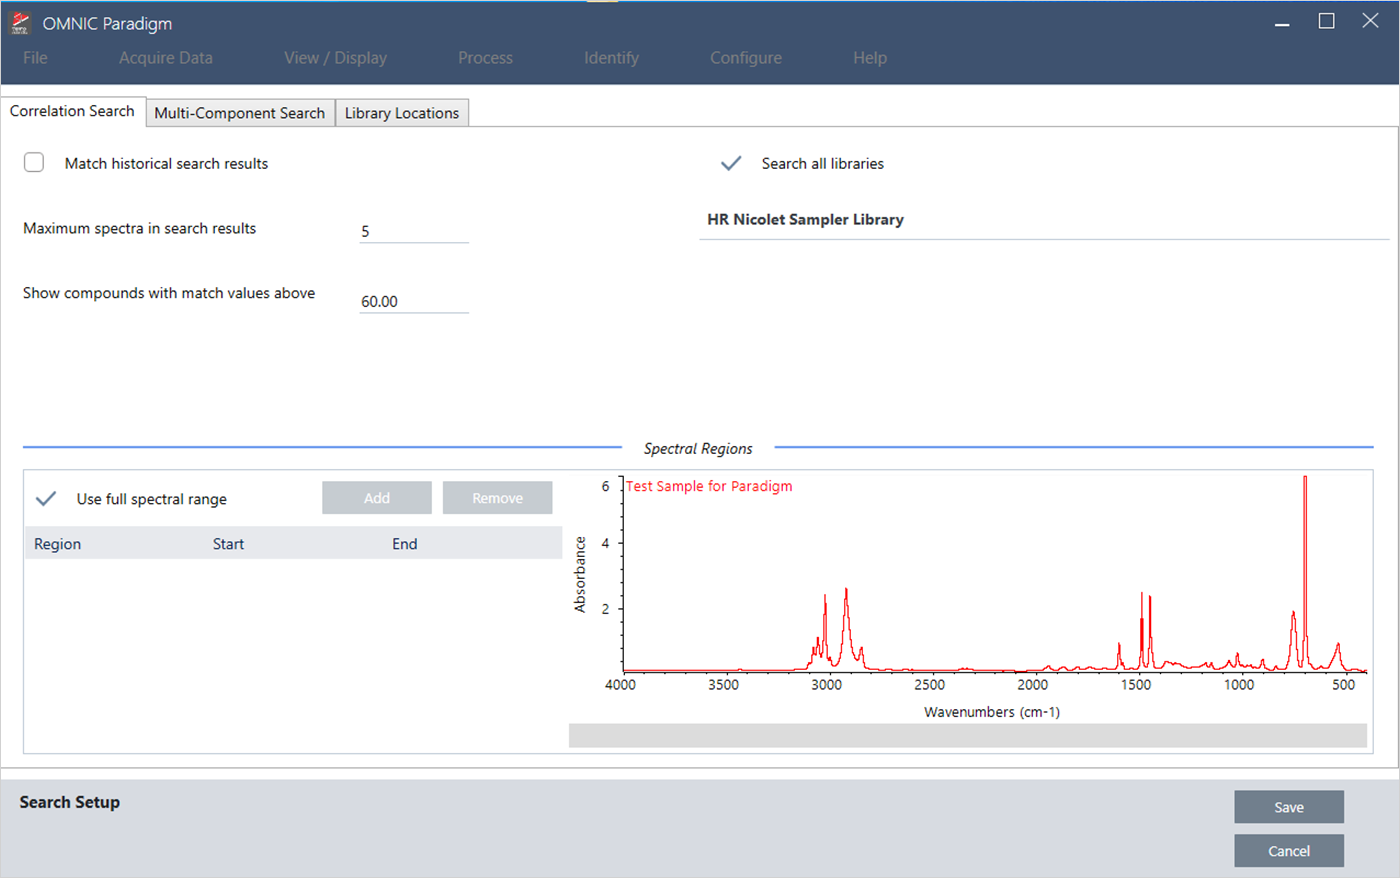
Correlation search settings
A correlation search compares your measurement to compounds in your libraries and returns the closest matches. The results include the match value for each compound with a value between 0 and 100, with 100 indicating a perfect match.
Correlation search settings
| Setting | Description |
|---|---|
| Match historical search results |
Select to have search results match those of legacy OMNIC applications. Select only if you are comparing new measurements with older data collected using legacy OMNIC software. |
| Maximum spectra in search results |
Limit the number of search results. For example, with a maximum of 5, the search will return only the 5 best matches. You can enter a value from 1 to 20. |
| Show compounds with match values above ____ |
Set a threshold for which matches are returned by the search. For example, with a value of 60, the correlation search will return only matches with a match value above 60. |
| Search all libraries |
Select to search all of your libraries. Clear the selection to specify only specific libraries to use for the search. |
| Use full spectral range |
Select to use the full spectral range for the search. Clear the selection to specify one or more limited ranges for the search. You can use multiple regions to exclude another region from the search. For example, include a region on either side of a totally absorbing peak to exclude it from the search. |
Correlation search results
The results of the correlation search are shown in the results pane, ordered by match value.
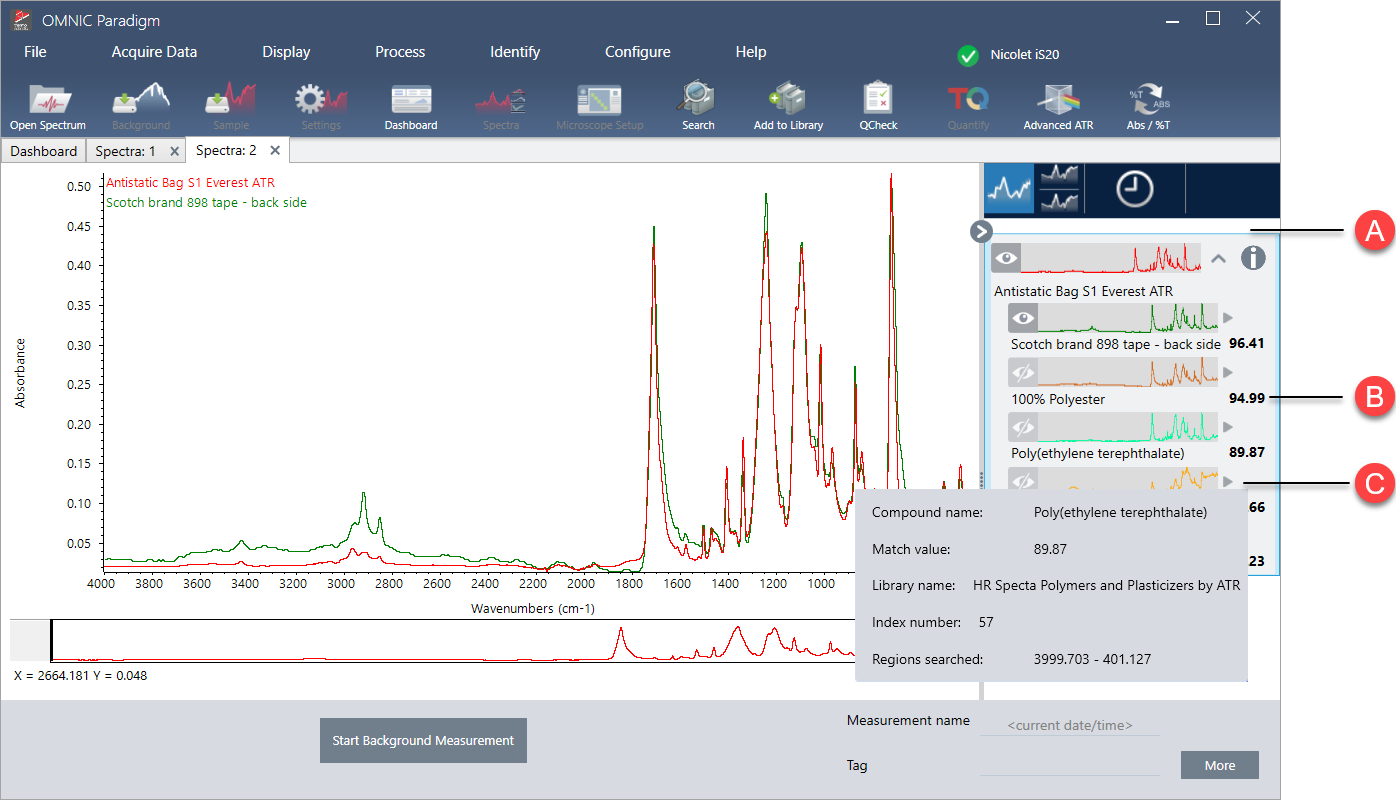
| A | The results pane displays your original spectrum and the results of the correlation search. The results are nested below the spectrum that was searched. |
| B | The match value represents how similar the match was to the original spectrum, with a match of 100 indicating a perfect match. |
| C | Hover over the gray arrow to view more details about the match, including the library where the match was found and the position in the library. |
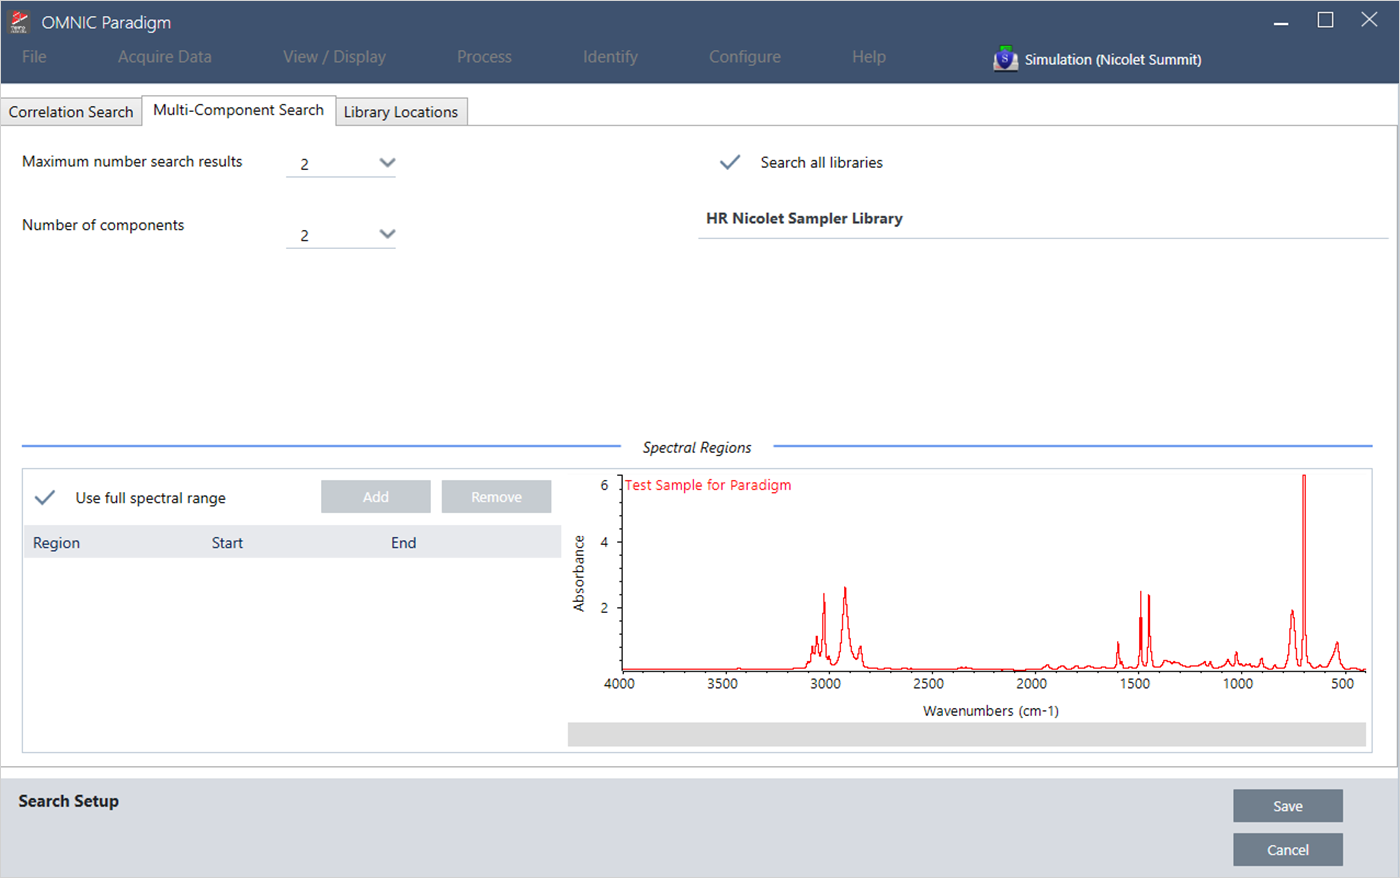
Multi-component search settings
Use multi-component search to identify the components making up your sample.
Multi-component search settings
| Setting | Description |
|---|---|
| Maximum number of search results | Limit the number of composite search results. |
| Number of components | Set the number of components to return for each composite. |
| Search all libraries | Select to search all of your libraries. Clear the selection to specify only specific libraries to use for the search. |
| Use full spectral range |
Select to use the full spectral range for the search. Clear the selection to specify one or more limited ranges for the search. You can use multiple regions to exclude another region from the search. For example, include a region on either side of a totally absorbing peak to exclude it from the search. |
Multi-component search results
The results of the correlation search are shown in the results pane, ordered by match value.
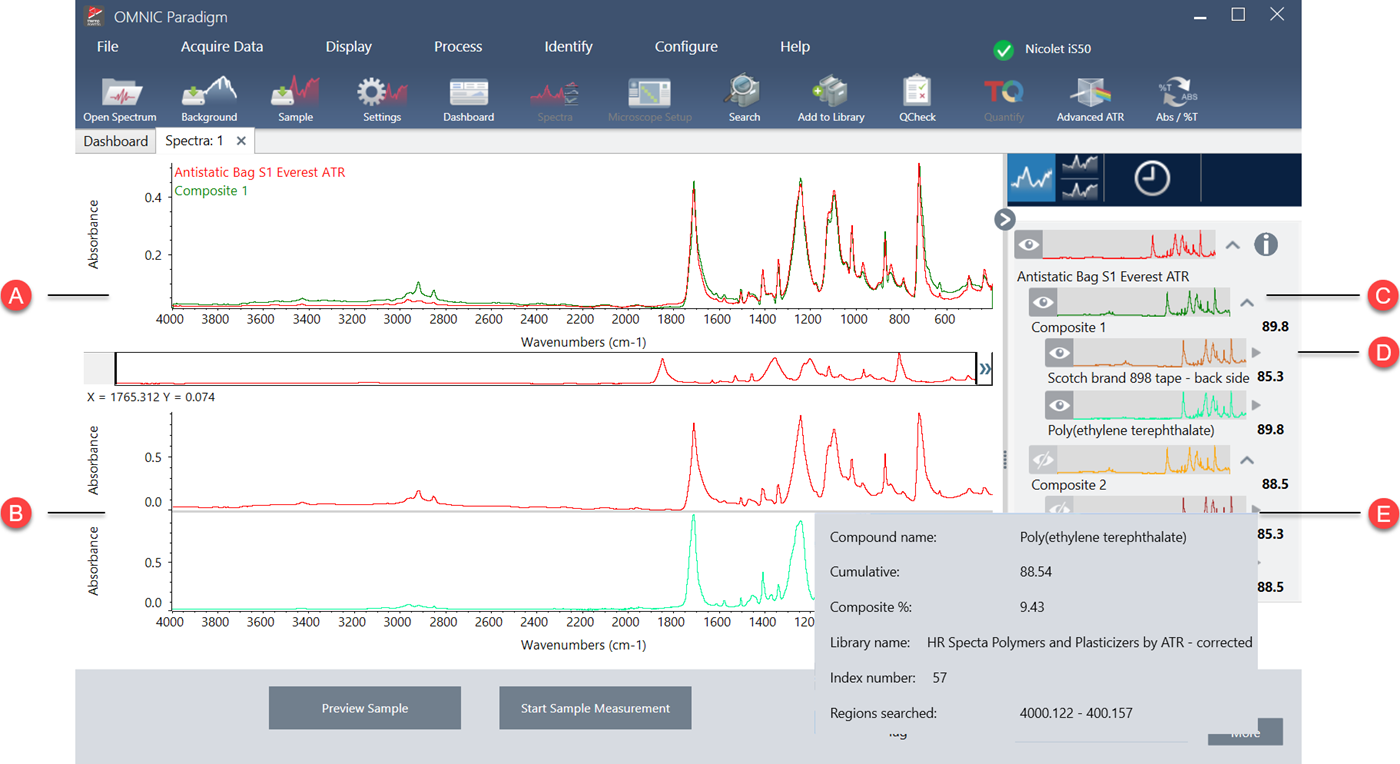
| A | The sample spectrum and the composite spectrum |
| B | Spectra of the compounds in the composite |
| C | The composite spectrum is a combination of the component spectra. The composite match value shows the overall match value and shows how well the composite spectrum matches the sample, with 100 representing a perfect match. |
| D |
Component spectra are nested under the composite that they are a part of. The cumulative value shows how each component contributes to the overall composite match value. The cumulative value for the first component shows its contribution to the overall match, and each additional component’s contribution adds to the overall match value. For example, consider a composite with a match value of 80, including a compound with a cumulative of 70 and a compound with a cumulative of 80. In this case, the first compound contributes 70 to the match value and the second compound contributes another 10 to the match value.
The composite percent value indicates the amount of the reference compound in the composite. For example, a composite value of 55% means the component contributes 55% to the total composite spectrum. The sum of the composite percent values is always 100%. Note that the composite percent value shows the contribution of the compound to the composite, not to the actual sample. In other words, a composite value of 55% for a found component does not necessarily mean the sample mixture contains 55% of that component. |
| E | Hover over the gray arrow to view details about each of the compounds. |