Verify Sample Composition with QCheck
Verify your sample quality with a QCheck analysis. With QCheck, your sample is compared to a known reference, and the results report a correlation value between your sample and the reference, giving you quick verification that your sample meets your specifications.
This guide walks you through an example QCheck analysis.
PREREQUISITES
This guide assumes that you have already set up your instrument and sampling accessory. For instructions on installing a sampling accessory, see the documentation that came with your instrument.
You will also need at least one spectrum to use as a reference. You can specify any spectrum in your database as the reference spectrum. To use a spectrum from a library, first extract the spectrum from the library so that it is available in the database. For details, see "Extract a Spectrum from a Library"
Performing a QCheck analysis
Running a QCheck analysis requires you to set up your analysis and measurement settings, measure the background, measure your sample, and interpret your results. Finally, when your analysis is complete, you can create and save a report.
❖ To verify your sample composition with QCheck
-
Set up the analysis.
Before measuring your sample, review your analysis settings.
a. Navigate to Identify > QCheck Setup.
b. Review the QCheck Setup options.
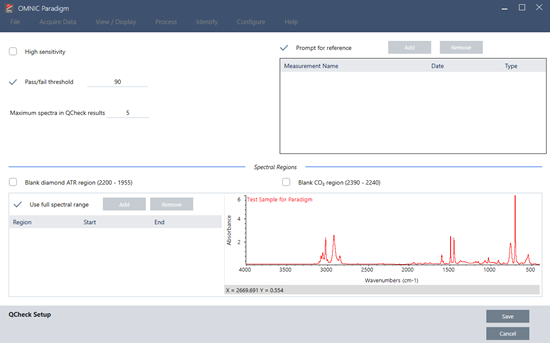
Setting Description High Sensitivity Select high sensitivity for more exact results between a sample that is very similar to the reference. You may want to de-select high sensitivity if you are measuring samples with some natural variation. Pass/fail threshold Set a threshold for pass or failure. Enter an integer between 0 and 100. A correlation value of 100 indicates a perfect match. If you de-select this option, all results will show Pass. Maximum spectra in QCheck results Sets the number of results shown in the results panel. For example, if you set the value to 2, only the two best matches will be shown in the results panel. Prompt for reference Select to choose a reference during the measurement. De-select to specify one or more reference spectra in advance. If you are planning to compare several samples to the same references, it is convenient to set them in advance to avoid having to keep selecting the same reference every time you measure a sample. Blank diamond ATR region (2200 - 1955) Select to exclude data in the region from 2200 wavenumbers to 1955 wavenumbers, where diamond ATR crystals absorb radiation. Blank CO2 region (2390 - 1956) Select to exclude data in the region from 2390 wavenumbers to 2240 wavenumbers, where carbon dioxide absorbs radiation. Use full spectral range Select to use the full range in the analysis. De-select to specify only a limited range to use for the analysis. c. To save your settings and return to the dashboard, click Save.
d. On the dashboard, review your measurement settings, and confirm that the listed sampling accessory matches the accessory you are using.
e. From the Analysis Type list, select QCheck.
Once you are satisfied with your measurement and analysis settings, you are ready to measure the background.
-
Measure the background.
Before measuring your sample, you need to have a current measurement of the background. The background spectrum is used to eliminate any signals in the sample data that are due to the spectrometer, the sampling accessory, or the background environment.
a. Click Preview and Measure Background.
b. Click Start Background Measurement. When the background measurement is complete, the spectrum is added to the results panel.
-
Measure your sample.
a. Load your sample. For instructions on loading a sample, see the documentation that came with your instrument or sampling accessory.
b. Click Preview Sample. The Sample Preview displays a live preview of your sample spectrum. The preview gives you the opportunity to correct any potential issues before measuring the sample.
c. When you are ready to continue, click Start Sample Measurement. If Prompt for Reference is selected in your analysis settings, the Select Reference Spectrum dialog opens after the measurement is complete.
d. Select one or more reference spectra to use in the analysis and click OK.
Hold Ctrl and click to add a spectrum to your selection.
Hold Shift and click to add a group of spectra to the selection.
-
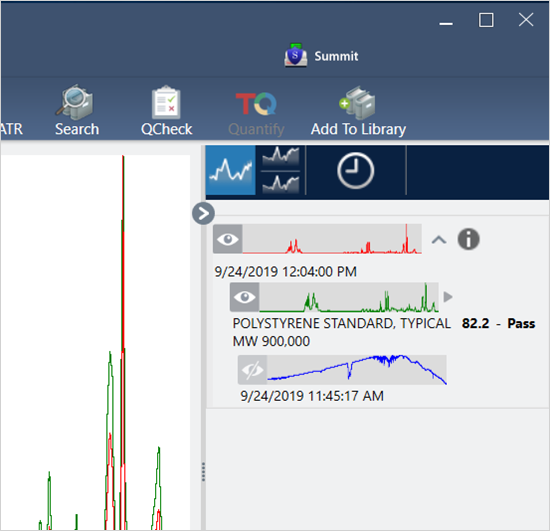
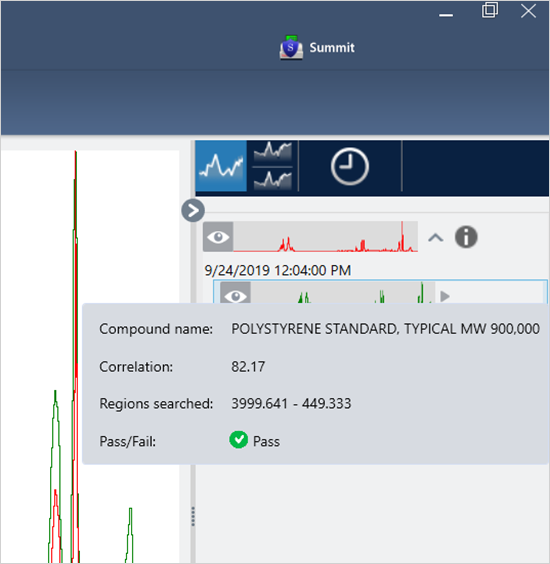
Interpret your results.
When the measurement and analysis are complete, your results are displayed in the results panel. Hover over the gray arrow for additional details.
-
Create a report.
When you are finished with your analysis, create a report to export your results to Microsoft™ Word™, PowerPoint™ or Excel™ or to print or save your results.
a. Navigate to File > Create Report.
b. Give your report a title.
c. Select a format from the Format list and choose the QCheck template. A preview of the report is shown in the right panel.
d. Click Create.
Improving your results
If your correlation value is lower than expected, there are several options to consider that may improve your results.
- Return to the dashboard and adjust the Resolution settings for your measurement. For example, you can measure the sample at a higher resolution by selecting a smaller value, such as 1 or 2. If the sample peaks are sharper or more numerous, you may get a more accurate analysis result.
- Increase the number of scans in your measurement, which may reduce spectral noise.
- If the sample spectrum has a tilted or curved baseline, try applying Automatic Baseline Correction to your sample and then restart the analysis from the Identify menu.
- Exclude selected regions from the analysis. If your sample spectrum has a peak that is so large it is off the Y-axis scale, you may want to exclude that peak from your analysis. These “flat topped” peaks are referred to as “totally absorbing” and may affect the analysis results. Open QCheck Setup, de-select Use Full Spectral Range, and select ranges that exclude the sample spectrum’s totally absorbing peak. Then, rerun the QCheck analysis.
Extract a spectrum from a library
Extract a spectrum from a library to use it as a reference in a QCheck analysis. Spectra extracted from commercial libraries can be used for analysis, but cannot be renamed, tagged, or exported.
❖ To extract a spectrum from a library
- From the dashboard of the desktop interface of OMNIC Paradigm software, navigate to Identify > Library Manager.
- Select a compound to extract.
- Click Extract. A confirmation message states that the spectrum was successfully extracted.
Next steps
In this guide, you set up and ran a QCheck analysis to verify that your sample matched a known reference within a pre-set threshold.
Next, see "Create and Run Your First Workflow" for a guided tutorial on using workflows to create routine, repeatable procedures.