About Time Series analyses
A Time Series analysis is useful for exploring how sample measurements change over time. For example, you can use a Time Series analysis to explore how a sample evolves during a TGA-IR or GC-IR experiment, or you can open a collection of standard measurements to see if your measurements remain consistent throughout a given week or month, alerting you to times when the measurements vary.
You can also create a Time Series analysis from a set of repeated measurements taken during a workflow. For instance, you might use a Repeat tile and a Delay tile to measure the same sample repeatedly for a given duration, such as taking a measurement every 60 seconds for an hour. Afterward, you can open the measurements in a Time Series analysis to explore how the sample changed over the duration of the workflow.
Use tags to organize your measurements and to make them easier to convert to a Time Series analysis later. Workflows can use the Tag tile to automatically tag all measurements, and individual measurements can apply a tag during data collection using the Tag setting on the dashboard.
Key concepts and terms
-
Time Series: A Time Series analysis consists of a set of 4 or more measurements plotted along a time period.
-
See "Create a Time Series analysis" for instructions on how to convert measurements to a Time Series analysis.
-
-
Profile: A profile is a representation of the series data and is used to show how the data changes over time. Each profile shows a different aspect of the measurement data, such as how a peak height or peak area changes.
-
See "Profile types" for a description of each profile.
-
See "Create and use profiles" for instructions on how to apply, save, and edit profiles.
-
-
History: In a Time Series analysis, the history includes all processing and display conversion operations. You can use the history to see what processing operations have been applied to the data and to remove specific operations.
-
See "Process Time Series data" for instructions on applying and removing processing operations
-
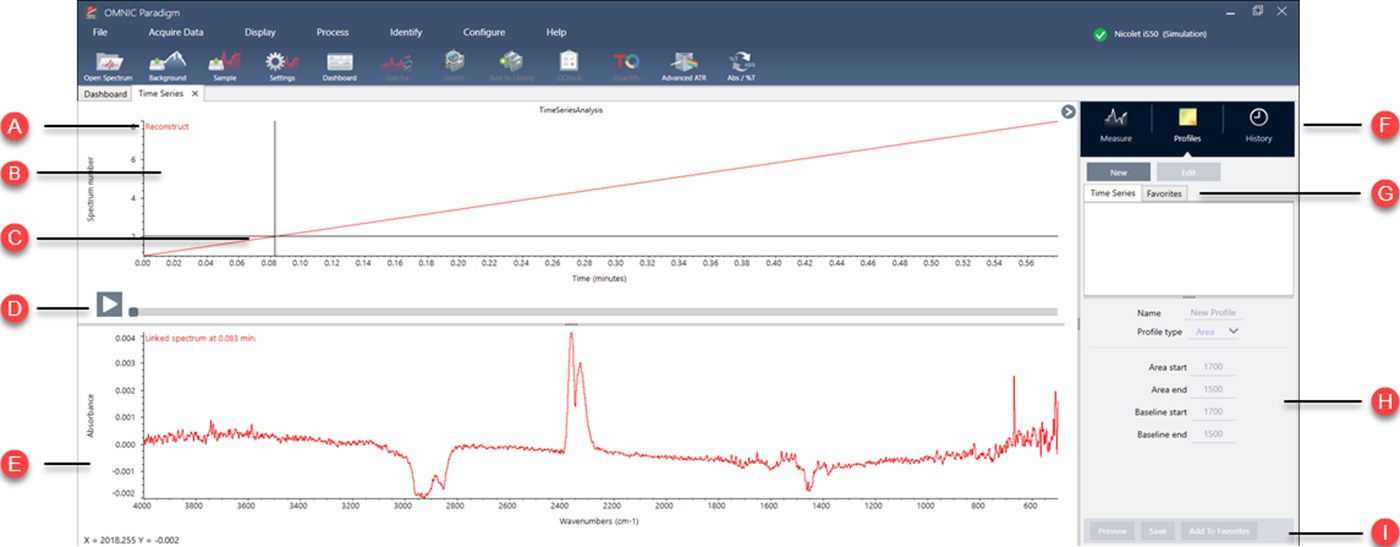
Overview of the Time Series window
When you open measurements in Time Series, the analysis window opens and displays your data.
|
A |
Profile name |
The name of the displayed profile. |
|
B |
Profile view |
The profile view shows the profile curve of all your currently saved profiles. Right-click to change the x-axis units. |
|
C |
Crosshair |
The crosshair shows the currently selected location in the profile. The spectrum corresponds to the selected location and the X and Y values are displayed in the lower-left corner of the screen. |
|
D |
Time line |
Use the time line to scroll through your measurements. The spectra pane shows the spectrum at the current point in the time line. With the time line selected, use the left and right arrow keys to navigate to earlier and later spectra. |
|
E |
Spectrum pane |
The spectrum pane shows the spectrum at the current time selected with the time line above. |
|
F |
Measure, profile, and history tabs |
The Measure, Profile, and History tabs
|
|
G |
Profile type tabs |
Use the profile type tabs to switch between your favorite profiles and your Time Series profiles.
|
|
H |
Profile settings |
The settings area displays the current settings for the selected profile. Use this area to edit the profile. |
|
I |
Profile actions |
When editing or creating a profile, you can preview or save it. After saving a profile, you can add it to your Favorites profiles or your individual Time Series profiles.
|