Create a Time Series report
Print or save a report to keep a record of your analysis results. Reports for a Time Series analysis show the following information, and each item is optional.
-
Title: The title of the report.
-
Profiles: The profiles section shows the image of all profiles currently applied. The Report shows only the Time Series profiles or the Favorites profiles, depending on which tab you are using when you create the report.
-
Spectrum: The spectrum section shows whichever spectrum was displayed when you went to the Create Report window.
-
Time series information: This section shows details about the analysis, such as the name of the user who performed the analysis, the date and time of analysis, and the number of spectra included.
-
Signature box: Including the signature box adds a space to add a signature, date, and additional comments.
To create a report for a Time Series Analysis:
-
From a Time Series analysis tab, go to File > Create Report.
-
Enter a Report Title and select a report format. Printed reports are also saved.
-
Select Options to customize what information is included in the report.
-
Select Create.
Find your saved reports on the dashboard with your other reports.
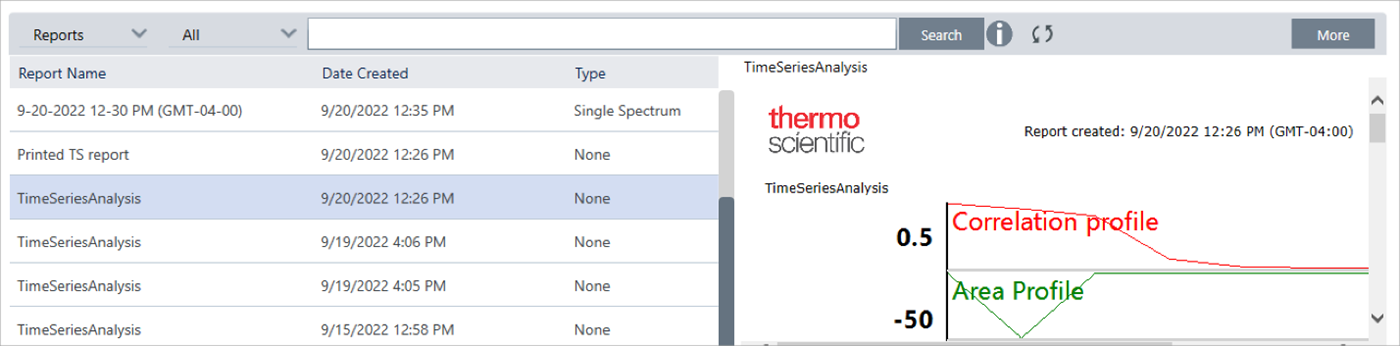
To view your saved Time Series reports, view Reports on the dashboard.