Using OMNIC Paradigm Software
Run your microscope and analyze your samples using OMNIC Paradigm software, Thermo Scientific's streamlined material analysis software. The user-friendly dashboard screen helps you view instrument status and recent work, process your spectra, conduct multi-component searching, and create new libraries. Designed with lab managers and science educators in mind, this software helps automate workflows using an intuitive drag-and-drop workflow creator. Work remotely and collaborate with colleagues around the globe when you upload OMNIC Paradigm data to the cloud using the Thermo Scientific OMNIC Anywhere application.
Interface
When working in microscopy, you will primarily work in the dashboard and the session views.
The dashboard
Begin a new session, edit measurement settings, view recent measurements, reports, and sessions, and view workflows on the dashboard.
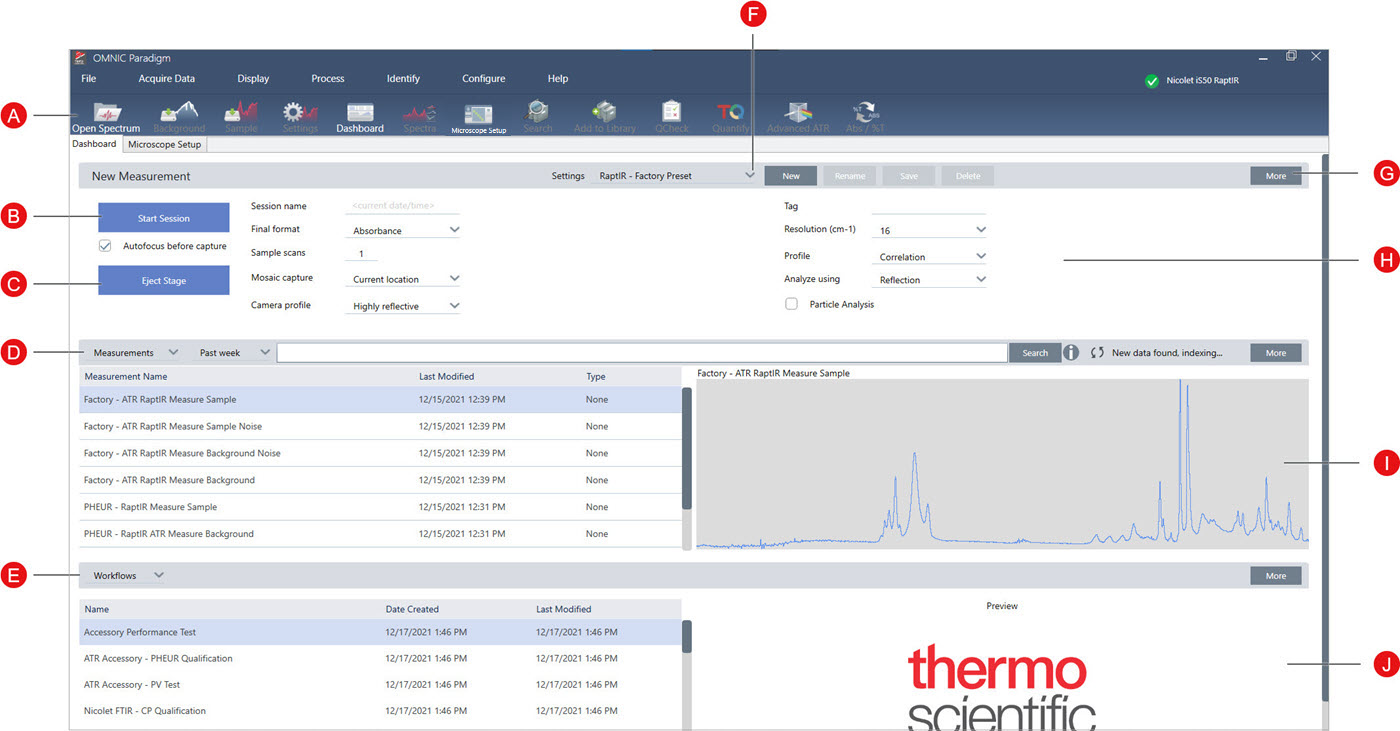
| A | Toolbar | The toolbar includes buttons for features and tools you will need use often and is used to navigate between the Dashboard, Session, and Spectral views. |
| B | Start Session | After you've loaded your sample and selected a mosaic capture location, click Start Session to switch to the Map view and automatically collect a mosaic image of the sample. Select Autofocus before capture to automatically bring the sample into the best focus. |
| C | Eject Stage | Ejecting the stage is optional. Ejecting lowers the stage and moves it forward so that you have more room to load your sample. After the sample is loaded, click Start Session to move the stage back into position or move it manually. |
| D | Measurements, Sessions, and Reports | Displays your Measurements, Sessions, and Reports. Choose a category from the list to switch views. |
| E | Workflows and Packages | Displays qualification and performance verification workflows as well as your custom workflows. For more on creating and using workflows, see OMNIC Paradigm software guides and tutorials. |
| F | Settings | Create, select, save, or delete collections of settings. |
| G | More | Click More to expand any of the main sections of the dashboard and to view additional settings or details. |
| H | Collection settings | The most commonly used settings are shown here, in the New Measurement pane. Click More to view additional advanced settings, including settings for background measurements. |
| I | Preview | Shows a preview image of the selected measurement, map, or report. |
| J | Workflow or package preview | Shows a preview image of the selected workflow or package. Locked workflows display a logo instead of the preview of the workflow. |
The microscopy session view
Analyze your sample using the microscopy session view. Here you can view your sample, define areas of interest for your analysis, and measure sample data.
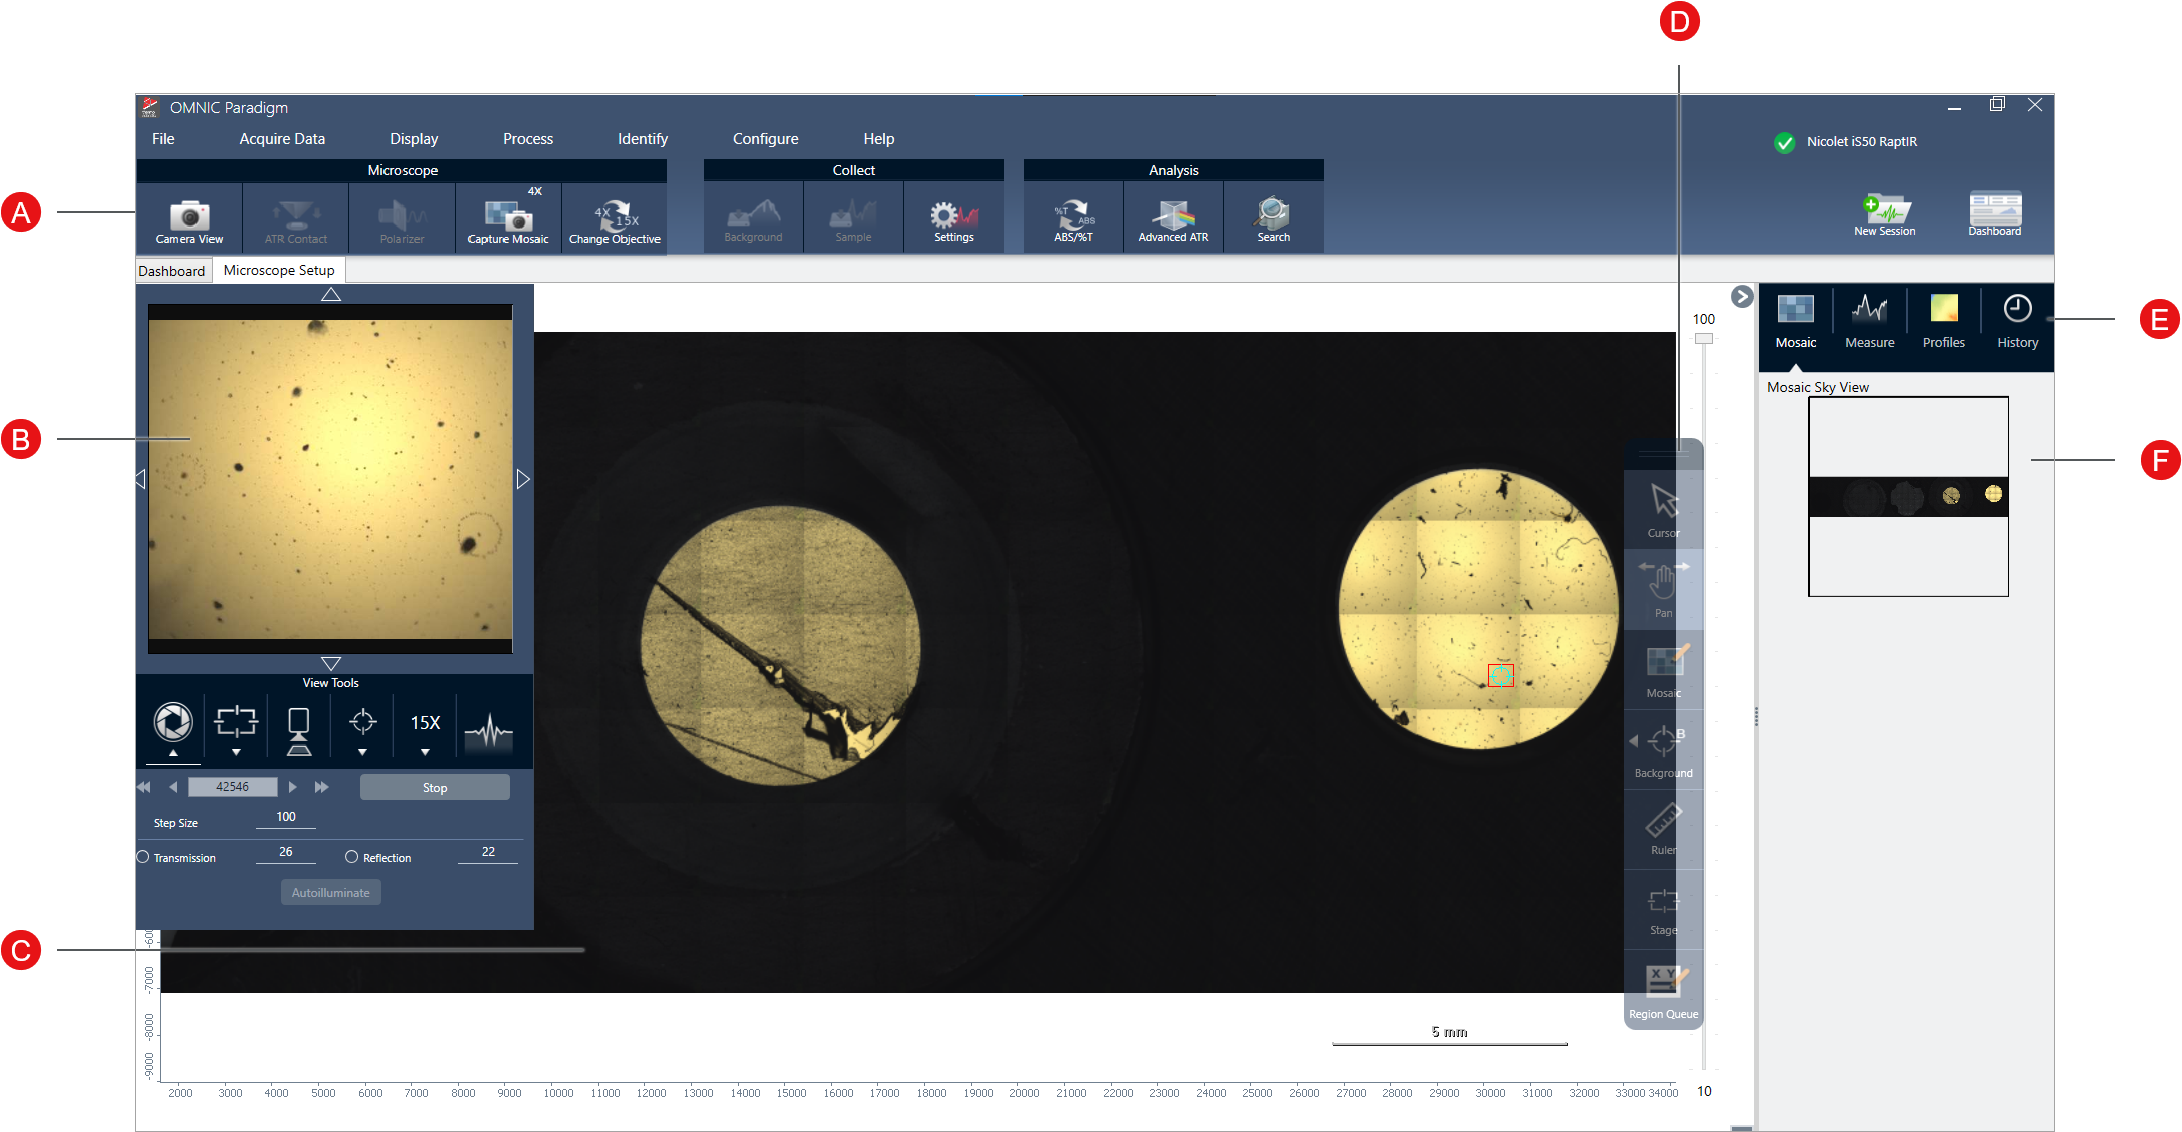
| A | Toolbar | View additional microscope settings and open the live camera view, capture a new mosaic, measure a spectrum, or navigate back to the dashboard. |
| B | Camera view |
Open the camera view to see the live visual image of the sample. Use the View Tools to adjust the illumination, focus, and aperture and to take a quick, snapshot mosaic, change objectives, or view a live interferogram signal. Use the arrows around the live image to move the stage without a joystick. |
| C | Mosaic view | Shows the mosaic image and is the primary workspace where you define your background point and regions for analysis. |
| D | Floating toolbar | Analysis and navigation tools for interacting with the mosaic image.
|
| E | Analysis panel | View your mosaics, background spectra, profiles, and history in the analysis panel. |
| F | Mosaic sky view | The sky view shows a high-level view of the mosaic. When you zoom in, the sky view shows you what part of the mosaic you are viewing. You can use the sky view to navigate around the whole mosaic. |