3D Analysis
With OMNIC Paradigm 2.6 and later, you can explore Time Series measurements in the 3D Analysis view. This view provides more ways to visualize your measurement and explore how your sample changed over time.
Overview of the workspace
The 3D analysis view consists of the following components: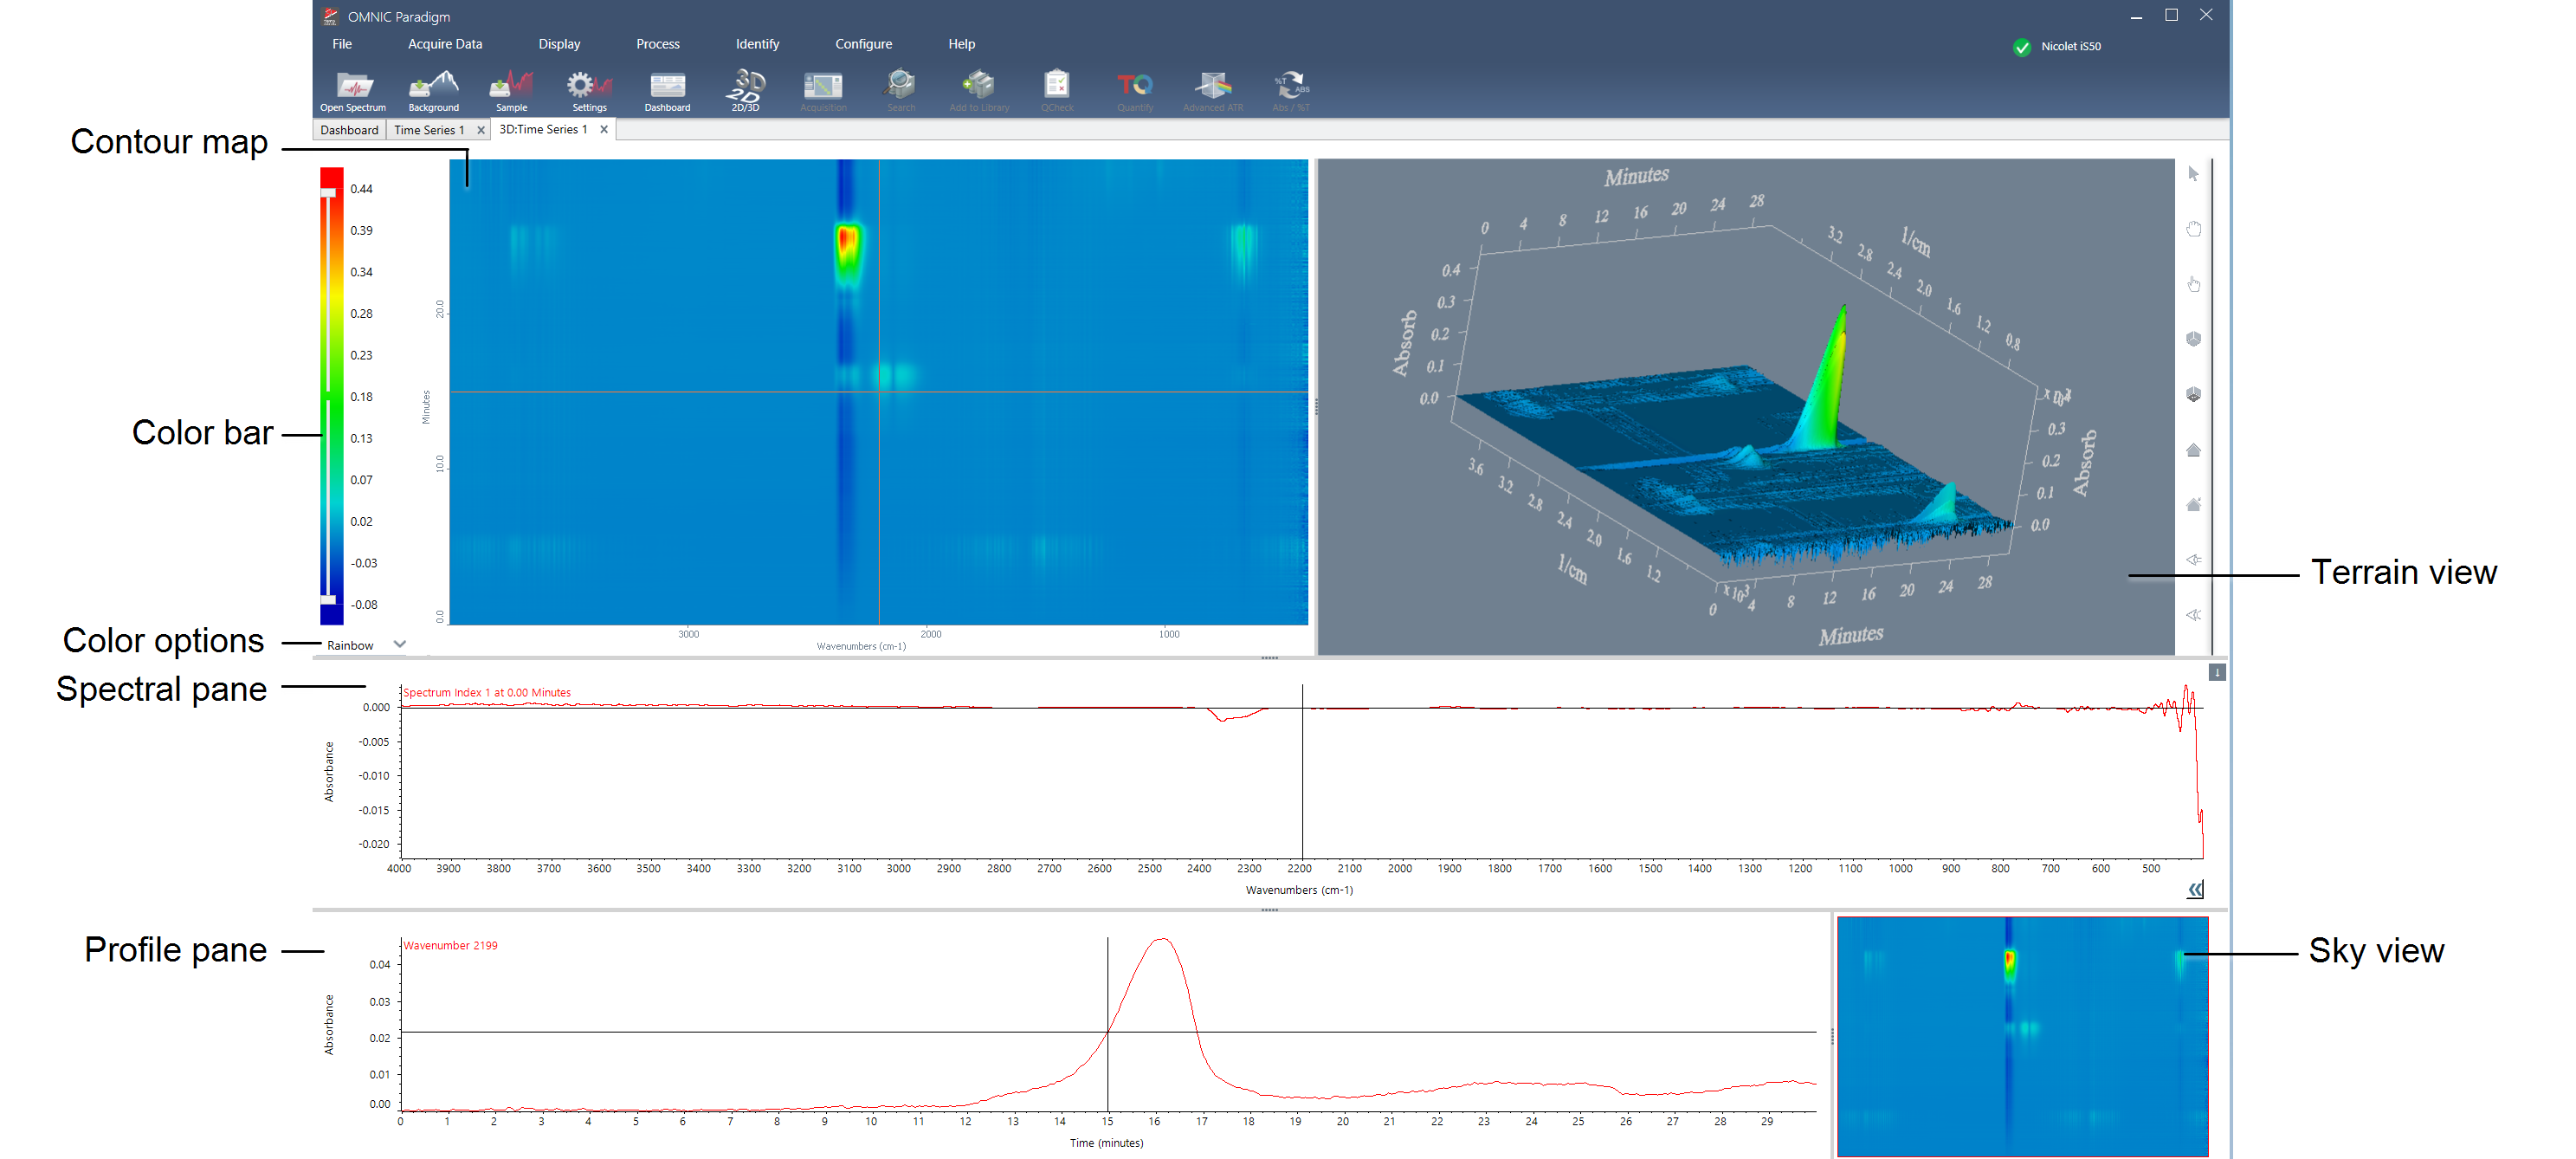
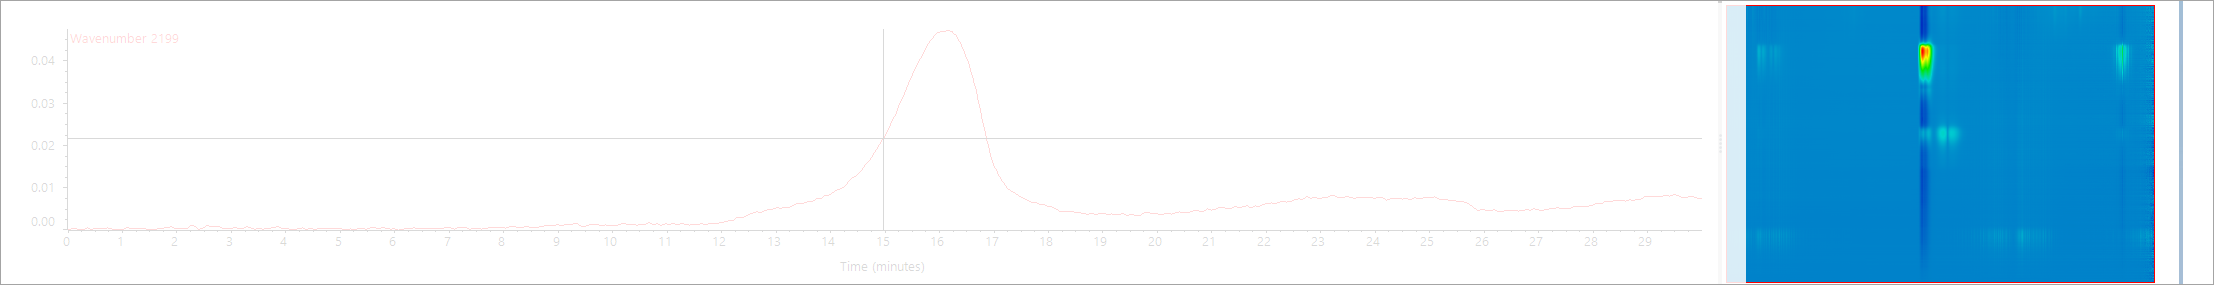
Contour map
The contour map is a visual representation of the series' spectral intensity over the experiment's duration. This is a useful way to visualize how peaks changed over time. Here is an example:
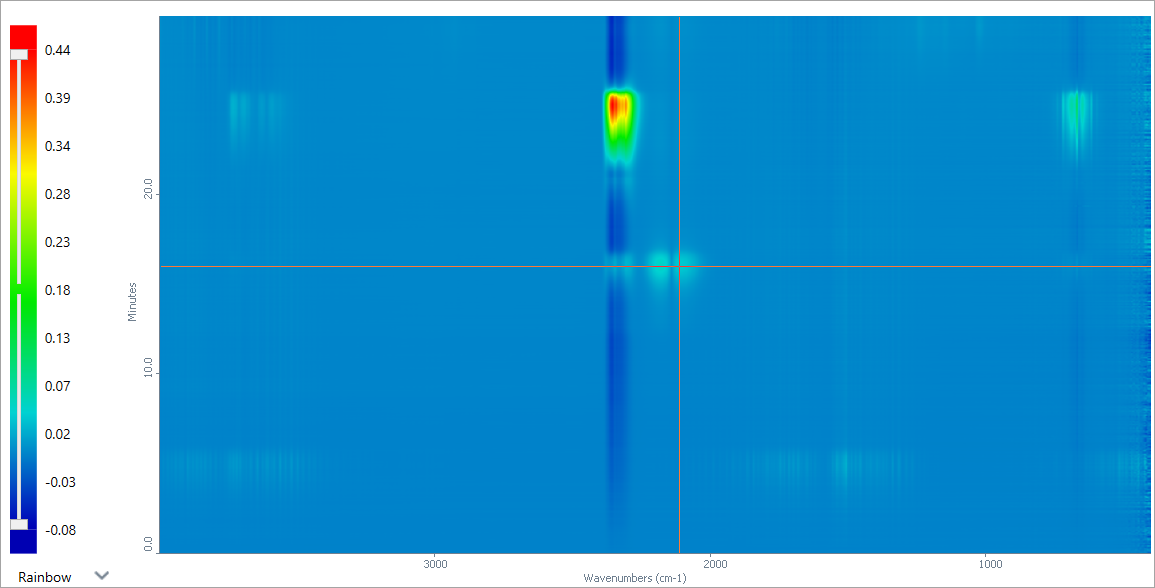
The X-axis of a contour map is in wavenumbers and represents the frequencies at which spectral bands occur. The Y-axis is in time units and represents the time that each spectrum in the series was collected.
Together, the colors and axes present a view of the data in three dimensions: spectral intensity (shown with color) at different frequencies (indicated by the X-axis) at different times (indicated by the Y-axis).
-
To view the spectrum at a specific time, click the map to view a point of interest. The crosshairs indicate the currently selected point, and all other panes are updated to show the data from this point. The spectral view shows the spectrum from this time and the profile curve highlights the time. The 3D view also shows an indicator that matches the crosshair location.
-
To change the color scale, select a color option from the list. Rainbow is the default color option. To adjust the scale, click and drag the white bars on the scale.
-
To zoom in, click and drag to draw a box around an area of interest, then click in the box. Before clicking in the box, you can adjust the selected range by dragging the handles on the corners and edges. The sky view in the bottom right pane highlights the area currently in view. To return to viewing the full map, use the sky view and double-click the highlighted region.Terrain view
Terrain view
The Terrain view shows series data in the form of a three-dimensional surface plot (a warped, interpolated surface).
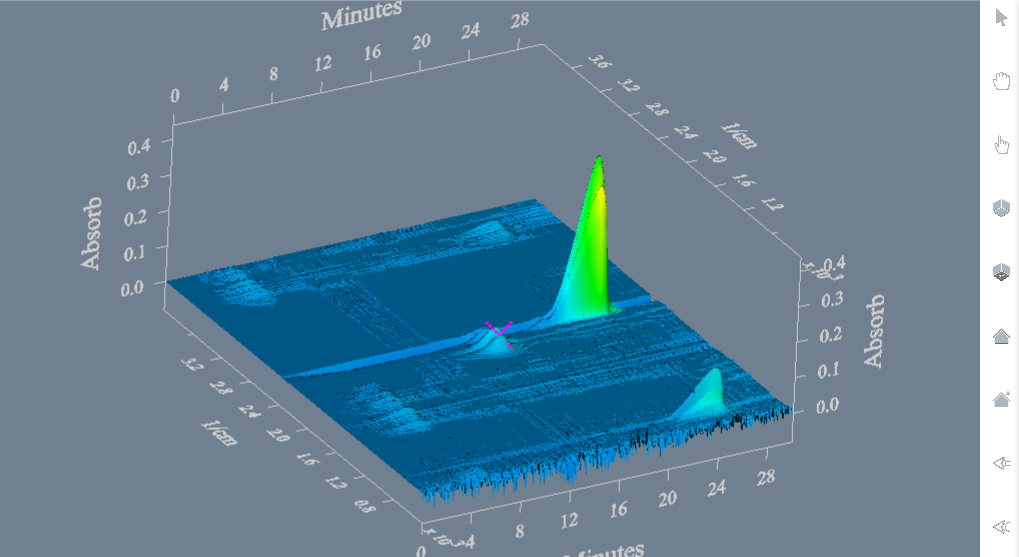
Depending on the currently selected navigation mode, you can rotate the image, zoom in or out, or drag the image within the pane. To select a mode, choose a tool from the tool bar. Use the scroll wheel on the mouse to zoom in and out.
| Icon | Tool | Description |
|---|---|---|
 |
Pick mode | Use pick mode to select points on the terrain view. When you select a point, the spectral view and contour map update to the corresponding data. |
 |
Rotate mode | Use rotate mode to rotate the camera around the 3D view. |
 |
Drag and move mode | Use this tool to drag the 3D image up, down, left, or right in the pane without rotating it. |
 |
View all | Recenter the 3D image in the pane. |
 |
XY view | This tool snaps the image to a flat, XY view, as if you were directly over the image and looking straight down. This view looks similar to the flat contour map. |
 |
Restore camera | After saving the camera position, select this tool to return the camera to the saved position. |
 |
Save camera position | Save the camera in the current view. Then, after you have moved the camera, click Restore camera to quickly return to the saved position. |
 |
Orthographic view | In orthographic view, parallel lines remain parallel. |
 |
Perspective view | In perspective view, parallel lines appear to converge at a distant vanishing point. |
When you click a point in the 3-D image, the spectral display pane changes to show the spectrum collected at the clicked time value. Also, the profile pane changes to show the spectral intensity versus time for the clicked frequency.
To copy the image, right-click the terrain view and select Copy to Clipboard. You can then paste the image into another application.
Spectral pane
The spectral pane shows the spectra or spectrum at the point currently selected on the contour or terrain view.
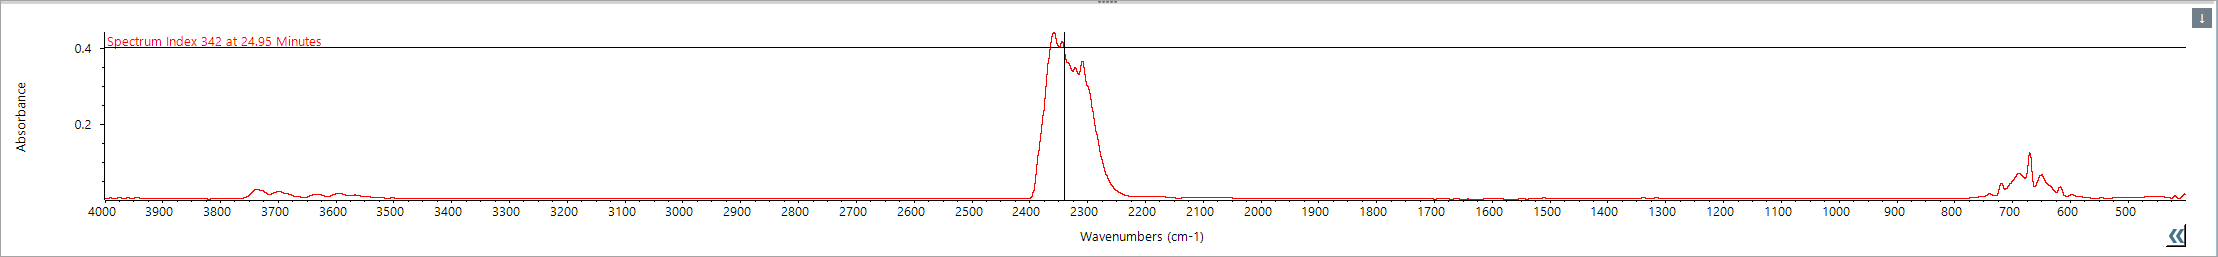
The spectrum is from the currently selected collection time and the crosshair shows the selected wavenumber. To view more than one spectrum, hold CTRL and click the contour view. You can view the spectra in overlay or stack view. Right-click the spectrum pane for more options.
Profile pane
The profile pane shows the intensity of the selected peak position over the duration of the measurement, with time along the x-axis and the intensity units in the y-axis. For example, in "Profile pane", the curve shows how the absorbance units increased beginning around 16 minutes into the measurement.
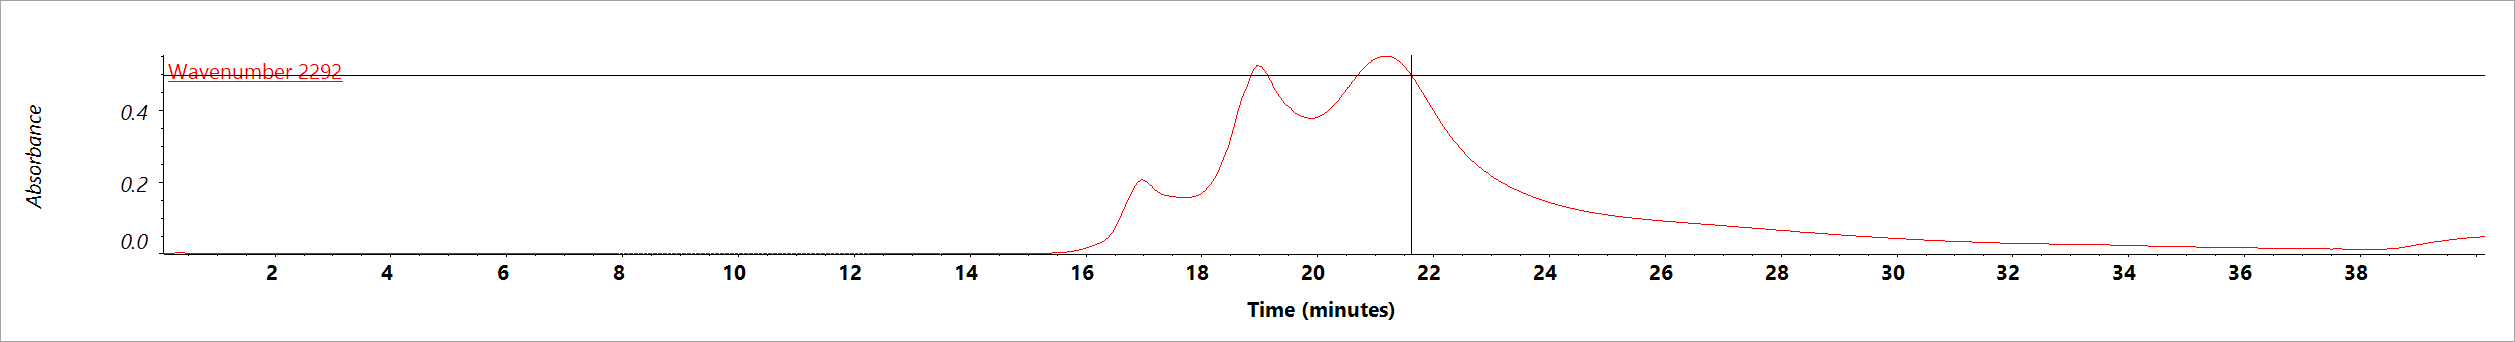
If you have multiple spectra selected and shown in the spectral pane, the profile curve shows only the first-selected wavenumber.
The crosshair shows the time currently selected in the contour or terrain view.
Sky view controls
The sky view, in the bottom-right corner of the window, highlights the region currently shown in the contour view and can be used to navigate the contour view.
When you have the contour view zoomed in, click the sky view to jump to a new location or drag the highlighted region to move the contour view.
Double-click the highlighted region to return the contour view to the full image.