Create a Time Series analysis
Create a Time Series analysis by selecting a set of measurements and opening them in Time Series.
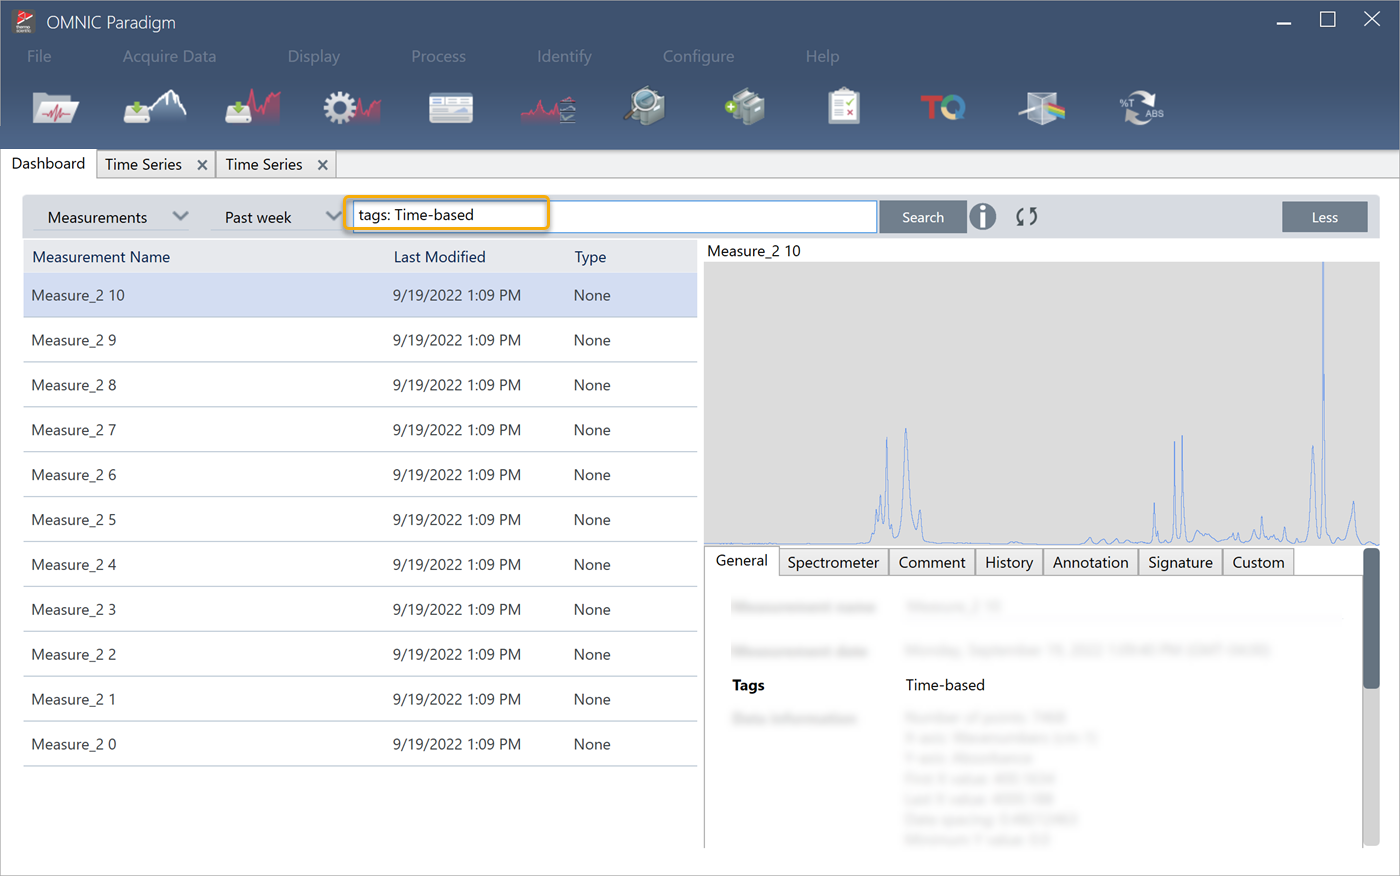
You can easily filter your measurements by using tags. If your desired measurements all share the same tag, you can search for that tag and then select all the measurements to create the Time Series analysis. The Tag tile in workflows can automatically tag every measurement your workflow collects.
After filtering the measurement list, select one measurement and then press CTRL+A to select all measurements.
Use the ‘tags’ keyword to limit your search terms to only tags.
Using tags to filter measurements
To create a Time Series analysis:
-
Select a set of measurements to view in Time Series.
With one measurement selected, hold SHIFT and click to select a group of measurements or press CTRL+A to select all measurements.
-
Right-click the measurements and select Open in Time Series.
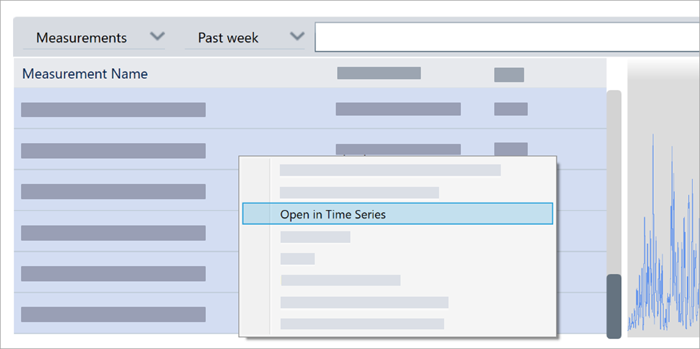
The Time Series analysis opens.