Create and Run Your First Workflow
This tutorial explains a simple way to create workflows in OMNIC Paradigm software. For basic information about workflows and brief descriptions of the workflow features and editing tools, see the article titled “About Workflows” in the OMNIC Paradigm online help.
The software operations to create workflows are available only in the desktop version of OMNIC Paradigm software (not the touchscreen version).
There are several ways to create workflows. Some approaches may work better than the others, depending on the steps you are trying to automate and how you want to start. For example, you can create a new workflow by:
- building a workflow from scratch
- editing a workflow that someone gave you
- duplicating an example workflow provided with the software
- performing the measurement tasks you want to automate and letting the software create the workflow from the spectrum’s history information
This article shows how the software can create a workflow automatically based on the history of an acquired spectrum. It also demonstrates how to:
- run a workflow from the workflow editor or dashboard
- identify workflow generated spectra
- edit a workflow by adding tiles, and
- fix a common workflow error
The last section provides useful tips for creating and editing workflows.
Create a workflow
❖ To create a new workflow from an acquired spectrum
-
From the OMNIC Paradigm dashboard, acquire a spectrum of a sample material.
It doesn’t matter what kind of material or sampling technique you use. If the software requires a new background measurement, go ahead and do that first. When the sample measurement is completed, the sample spectrum is displayed in the spectral view.
Here is our example spectrum (plastic bag measured with an Attenuated Total Reflectance, or ATR, accessory) displayed in the spectral view:
_Spectrum.png?revision=1)
-
Make sure the spectrum is selected in the spectral pane and then perform any processing or analysis steps you like (for example, subtraction, baseline correction, correlation search, etc.).
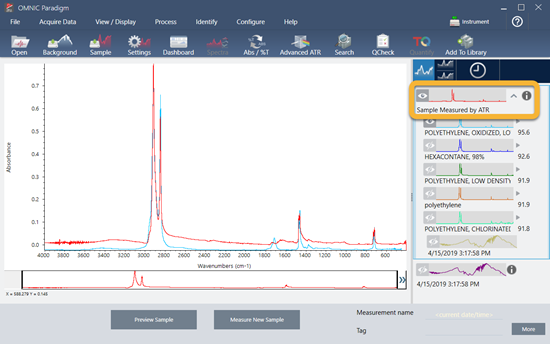
Here is our example spectrum after applying Advanced ATR Correction and Automatic Baseline Correction and then performing a Correlation Search.
_Correlation_Search.jpg?revision=1)
-
Give your spectrum a descriptive name (the software will use this name for the created workflow as the default, or you can give the workflow a new name).
- Right click the image of the original spectrum in the results panel and choose Rename Spectrum.
- Replace the default name with a descriptive name for your workflow and choose OK. Here is our renamed example spectrum.
-
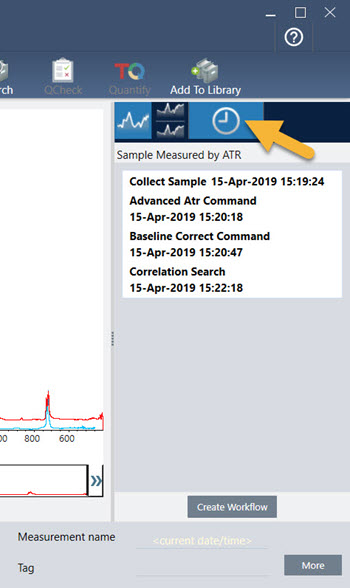
Once you have completed your processing and analysis steps, click the
History button in the results panel. The history panel shows all the tasks performed on the selected spectrum in the order in which they were performed. Here is the history information for our example spectrum.
-
At the bottom of the history panel, click Create Workflow.
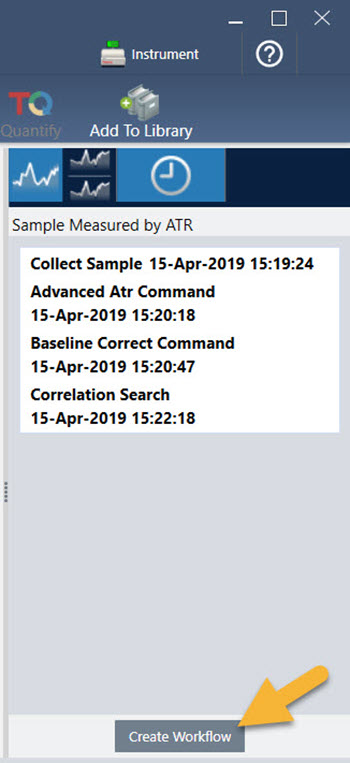
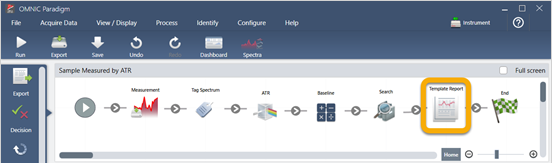
The software creates a workflow that includes all of the steps you just performed. The workflow is displayed in the workflow editor. Each performed task is represented by a colorful tile. Depending on which steps you performed, your workflow may look different from our example below:
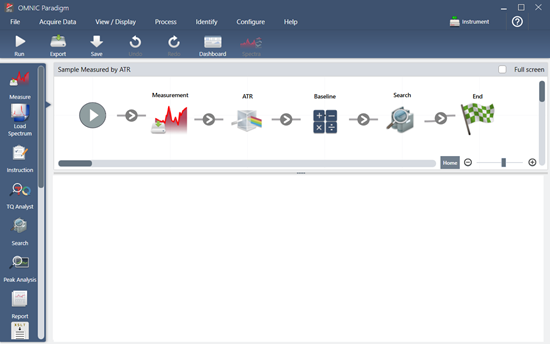
-
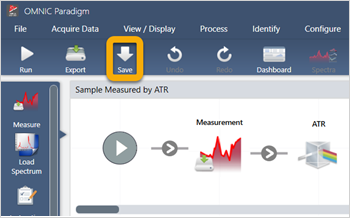
To save your new workflow, click the Save button on the toolbar.
-
To run the workflow, click the Run button on the toolbar.
The workflow performs the same tasks you completed manually in exactly the same sequence. In our case, we measured a spectrum, performed an Advanced ATR Correction, corrected the spectral baseline, and performed a correlation search.
When the workflow is done, the software returns to the Workflow Editor.
-
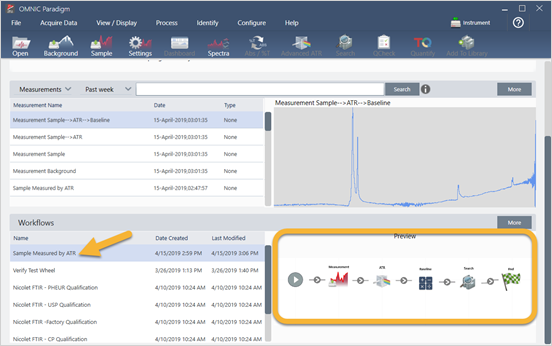
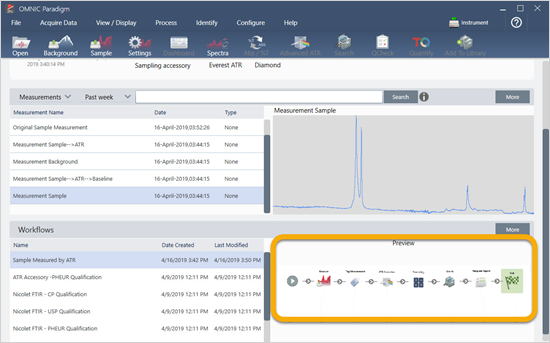
Click the Dashboard button on the toolbar to see your newly created workflow in the Workflows list. The workflow is named automatically based on the name of the spectrum used to create it. Here is our newly created example workflow in the Workflows list and a preview of the workflow in the preview box.
-
The workflow-generated spectra appear in the Measurements list.
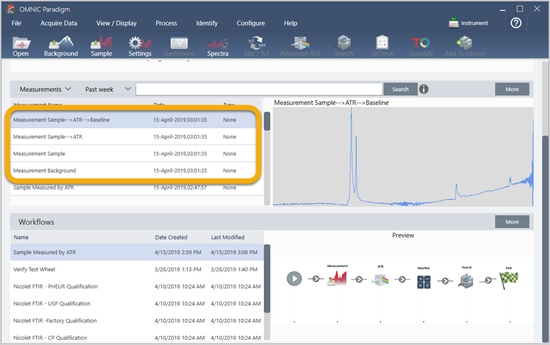
Our example workflow created four spectra, the measured background spectrum, the measured sample spectrum, the ATR corrected sample spectrum, and the ATR and baseline corrected sample spectrum with the search results. The workflow-generated spectra are named with the Tile Name properties of their associated workflow tiles.
Add tiles to a workflow
This section demonstrates how to use the workflow editing tools to add tiles to your auto-generated workflows.
-
From the dashboard, right-click the workflow name and choose Edit.
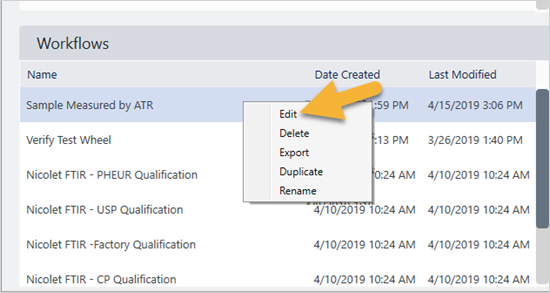
The workflow opens in the workflow editor.
-
Add a Tag Spectrum tile to the workflow.
Workflow-generated spectra are saved in the OMNIC Paradigm database along with any data acquired manually. Let’s tag the workflow spectra to associate them with our workflow. This makes it easy to open and view them later.
-
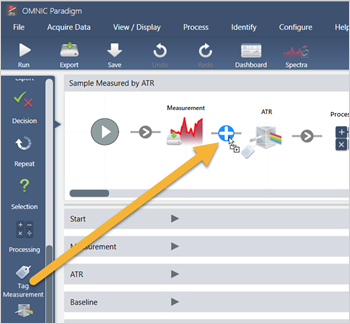
In the workflow editor, drag the Tag Measurement tile from the selection bar to the canvas so that your mouse cursor hovers over the grey arrow between the Measurement and ATR Correction tiles.
The grey arrow changes to a plus sign.
-
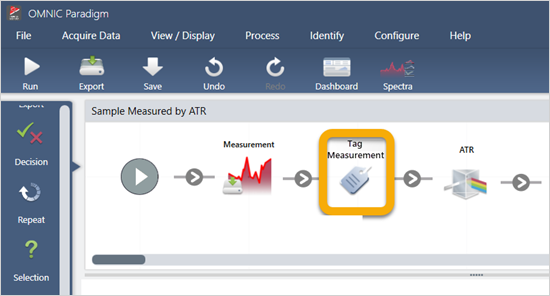
Release the mouse button. The tile is added to that location in the workflow and its settings box is opened below the canvas.
-
In the Tag Settings enter a base name for your workflow-generated spectra, such as “ATR Search Spectra”, make sure Select Spectrum is set to your measured spectrum (“Measurement - Sample”), and choose OK.
The Tag Measurement tile will automatically add the “ATR Search Spectra” tag to each spectrum generated by the workflow. We’ll explain how to search for those spectra later. Now let’s explore what happens when we add a tile that flags an error.
-
-
Add a Report Template tile to the workflow.
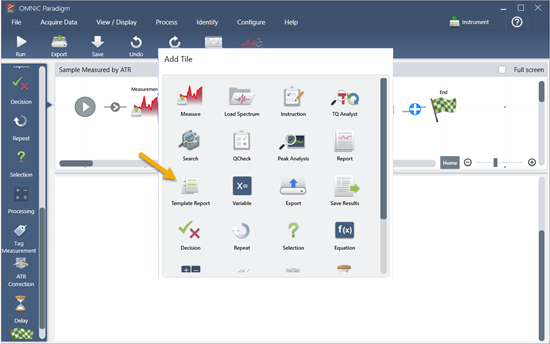
- In the workflow editor, use the mouse to hover over the grey arrow between the Search and End tiles (arrow changes to a plus (+) sign) and then click the mouse button. The software opens the Add Tile box. (This is another easy way to add tiles.)
-
In the Add Tile box, select the Template Report and choose OK.
The tile is added to that location in the workflow.
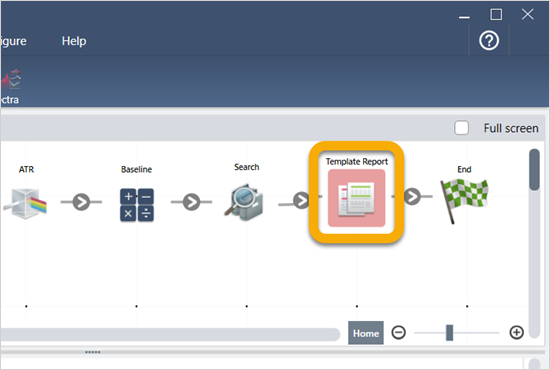
Notice that the Report Template tile has a red border, which indicates the workflow won’t run successfully right now. If we view the Report Template settings, the boxes are all blank.
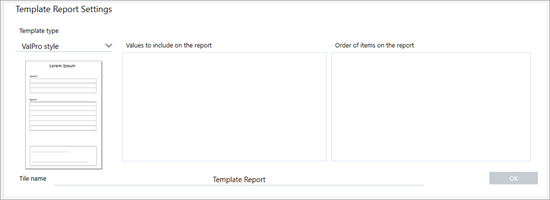
To fix the problem, we need to specify a template for the report and which results to include.
-
Set Template Type to your preferred report style (we are using the Search Results template), set Search Results To Display to your workflow’s output (“Search Result” in our example) and choose OK.
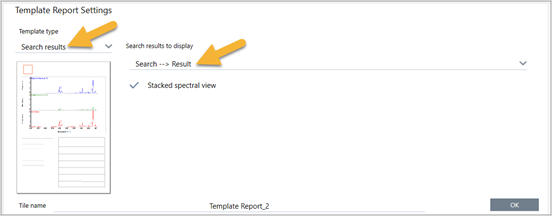
Notice that the red border is no longer there.
- In the workflow editor, use the mouse to hover over the grey arrow between the Search and End tiles (arrow changes to a plus (+) sign) and then click the mouse button. The software opens the Add Tile box. (This is another easy way to add tiles.)
-
To save the updated workflow, click the Save button on the toolbar.
-
To run the workflow, click the Run button on the toolbar.
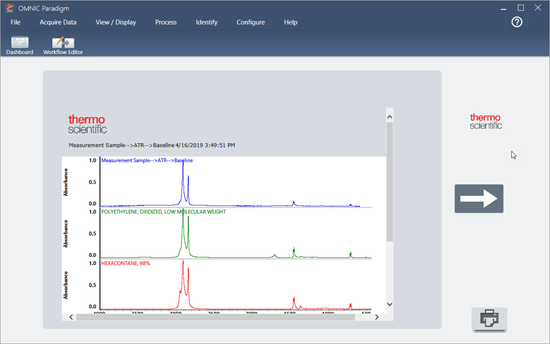
The workflow runs through all the steps and then displays the final report. Click the arrow button to end the workflow.
-
Click the Dashboard button on the toolbar to return to the dashboard.
-
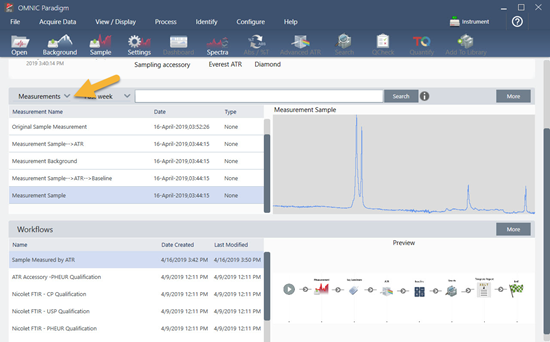
If you select the workflow in the Workflows list, the preview has been updated.
-
If you enter your tag in the Search box, the software shows you the workflow-generated spectra in the Measurements list.
To view the spectra in the spectral pane, use Shift + Click to select all four in the Measurements list, then right-click and choose “Open Selected Measurements.”
-
To see the workflow-generated report, click this arrow button and select “Reports.”
Tips on creating workflows
Before you head off to create more workflows, read through these answers to common questions about workflows and tips for solving any problems that may occur.
-
Is the order in which the tiles appear in the workflow important? Yes, the order of the tiles is important. Each workflow tile builds on the previous tiles, and all the tiles are interconnected by their input requirements and their output results. For example, if you add a Measure tile, it creates an output result (a spectrum), which can only be accessed by tiles positioned after the Measure tile in the workflow. If you want to correct the baseline of an acquired spectrum, you would need to add a Processing tile after the Measure tile, and then set the Processing tile input to the Measurement output (i.e., the spectrum). Otherwise, the Processing tile will have a red border, indicating it contains options that must be set before the workflow will run. If you see a tile that has a red border, use the mouse to hover over that tile for help finding the source of the problem.
-
Do I need to add a background measurement to my workflow? Not unless you want the workflow to perform an operation only on the background spectrum. If you only need a background spectrum in order to process your measured sample data, then you just need to add a Measure tile to the workflow and use the Measure tile settings to define the background measurement.
-
Can I change the titles of the workflow tiles? Each workflow tile has a setting that specifies the tile name. (Doubleclick the tile in the workflow editor to open its associated settings.) The Tile Name setting can be used to add detail to your workflow. This can help the workflow developer keep things organized, especially when creating workflows that contain multiple paths or loops, or multiple tiles of the same type (several Measure tiles, for example, in the same workflow).
The tile names may also be used to name output files when the workflow is run. Here are some examples:
- Measure tile. This tile acquires background and sample spectra. When the workflow is run, the sample spectrum is saved with the tile name of its associated Measure tile.
- ATR Correction Tile, Process Tile, etc... Tiles that operate on acquired spectra generate output spectra that are saved along with the final sample spectrum when the workflow is run. Each interim “processed” spectrum is saved with the tile name of the workflow tile that generated it.
- Report tile. This tile creates a sample report. When the workflow is run, the report is saved with the tile name of its associated Report tile. l
-
Should every workflow have an Export tile? The answer to this question is “no.” Any spectra and reports generated from a workflow are saved automatically in the OMNIC Paradigm database, along with all the other spectra and reports that are created manually with the spectrometer (that is, not from a workflow). If you want to save your workflow-generated spectra and reports as files that can be archived or opened elsewhere (from your OMNIC Paradigm workstation software, for example), use an Export tile to create those files automatically.
-
Why doesn’t my workflow run? Before you run a newly created workflow, ensure there are no tiles with a red border. Here is an example:
The workflow will not run to completion if it contains a tile with a red border.
If your workflow has a red bordered tile, use the mouse to hover over the tile for tips on how to solve the problem. Typically, the red border indicates the tile contains required options that have not been set. However, it can also mean the tile is “illegal.” For example, if you place a Processing tile before a Measure tile in a workflow, the Processing tile will have a red border and the workflow will contain an unresolvable error because there is no output spectrum to baseline correct.