Identify an Unknown Sample with Transmission
Your FTIR spectrometer and Thermo Scientific™ OMNIC Paradigm software can help you identify the chemical composition of an unknown sample. This article demonstrates how to measure and analyze a sample using infrared transmission. By “transmission” we mean that the infrared beam passes directly through the sample. Transmission is a common technique for acquiring FTIR data. This article includes a number of examples to help you build confidence in interpreting your analysis results.
You will learn how to:
- Prepare the transmission accessory
- Set up and run the analysis, and
- Evaluate and confirm the results
Prepare the transmission accessory
To begin, make sure your transmission accessory or sample holder is inserted in the spectrometer sample compartment.
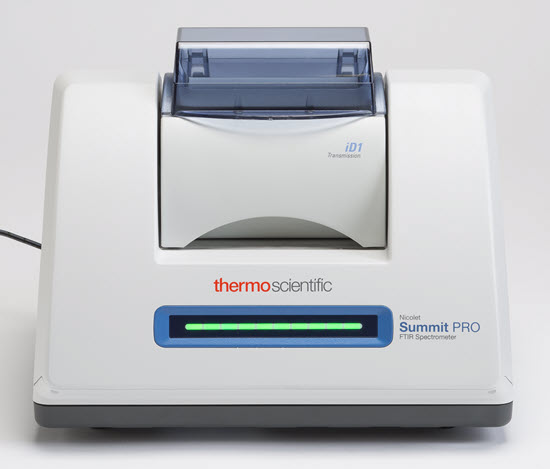
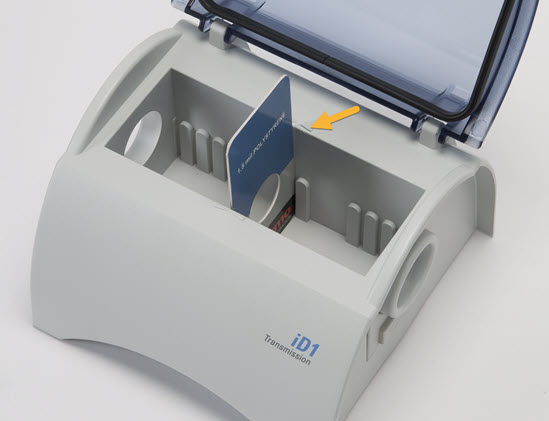
Here is the Thermo Scientific™ iD1 Transmission Accessory in our Nicolet™ Summit FTIR Spectrometer.
Remove any sample from your accessory or sample holder so the spectrometer can take an accurate background measurement when it’s ready. The iD1 accessory cover can be open or closed. (If your transmission accessory is purged with dry air or nitrogen, keep the cover closed unless you are adding or removing a sample.)
Set up the analysis
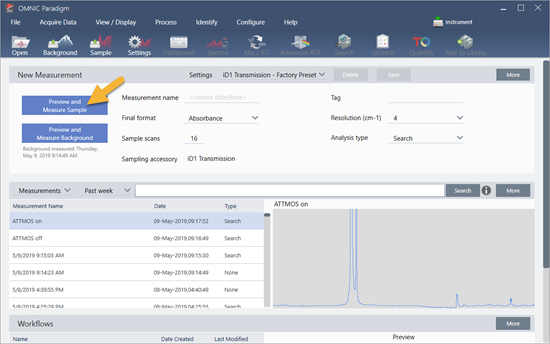
The next step is to set up the OMNIC Paradigm software. After you open the software, you see the dashboard in the main window. The important measurement settings are at the top.
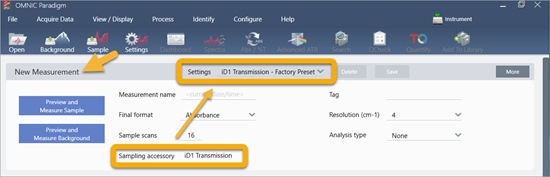
First, make sure the Sampling Accessory readout shows the installed accessory. If it doesn’t, reseat the accessory. Notice that the factory presets for that accessory appear under “Settings.”
Then enter a measurement name, or you can leave the suggested name, which is the exact date and time of the measurement.
Next make sure the Analysis Type is set to Search.
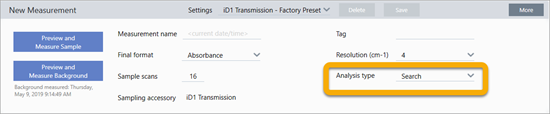
This performs a point-by-point comparison of the sample spectrum against FTIR library spectra. The quality of the output depends on the source and quality of the spectra in the selected libraries.
Finally, check the acquisition settings (sample scans, resolution and final format). The settings shown above are all good starting values for this analysis.
It’s important to note that the quality of the sample data you acquire will affect the analysis results. For example, speeding up the analysis by measuring fewer scans, or decreasing the resolution could lead to a less certain analysis result.
Consider your spectral libraries
All existing spectral libraries are selected automatically by default. Choose Search Setup in the Identify menu to view or change your library selections. For this demonstration, we are using the free libraries provided with OMNIC Paradigm software and the Nicolet Summit Pro spectrometer.
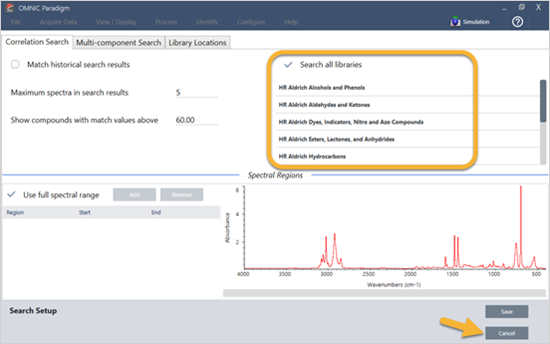
Choose Cancel to close the Search Setup window.
You can also use the Library Manager in the same menu to easily create a spectral library. Any libraries you create should be from pure materials that represent what you expect to find in your unknown samples.
The library spectra are normally the same quality or higher quality than the sample spectrum. It is also helpful if they are acquired using the same sampling technique (transmission in this case). There is no need to perform conversions such as final format, resolution or spectral range on the sample data before performing a search—the software does that for you.
Measure and analyze the sample
To start the analysis, click Preview and Measure Sample.
The analysis starts with a background measurement. The only requirement for a transmission background is to remove any sample from the path of the infrared beam. The background spectrum is used to eliminate any signals in the sample data that are due to the spectrometer, your transmission accessory or sample holder, or the background environment.
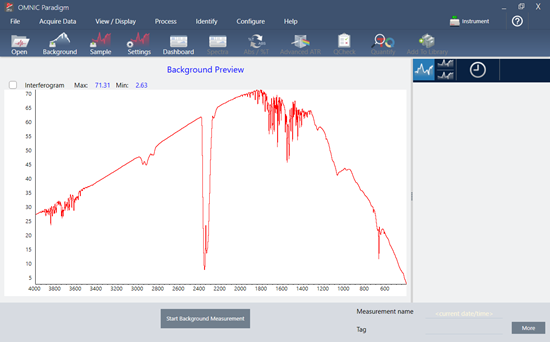
The software shows a preview of the current background spectrum in the spectral pane. The examples below show typical background spectra for transmission analysis using a transmission accessory that has not been purged with dry air or nitrogen, and one that has been purged.
Background spectrum from a transmission accessory that has not been purged
Background spectrum from a transmission accessory that has been purged
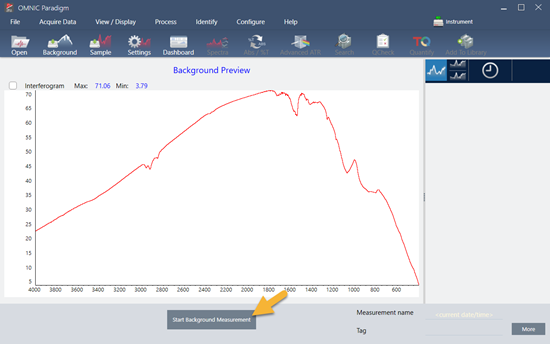
Click Start Background Measurement.
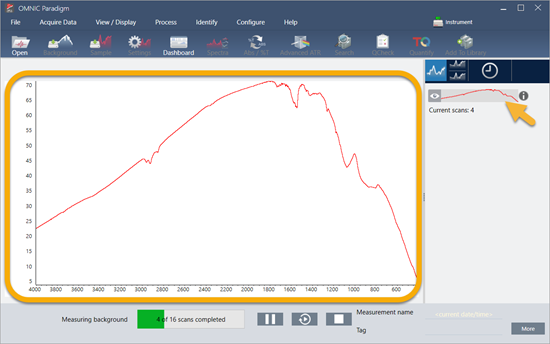
When the background measurement is completed, its image appears in the results panel and in the spectral pane.
To install a mounted film sample, open the cover for the transmission accessory and slide your sample or sample holder into a slot that best fits the sample or sample holder width. If your sample or holder allows it, choose a slot that is close to the beam’s focal point (for the iD1 accessory, this is roughly in the center of the sample compartment). For this demonstration, we are measuring a plastic film mounted on a sample card.
iD1 Transmission Accessory beam focal point
Once a sample is in place, click Preview Sample to preview the sample data in the spectral pane.
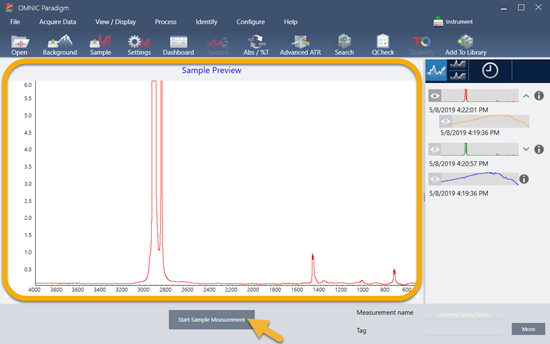
If the peaks in the preview spectrum are very small, try using a thicker sample. If the spectrum has no sample peaks, check that the sample material transmits energy in the infrared spectrum.
When you are ready to continue, choose Start Sample Measurement (see the previous image) and wait for the progress bar to complete. The software quickly compares the sample spectrum to the selected library spectra and shows you the results.
What’s in my sample?
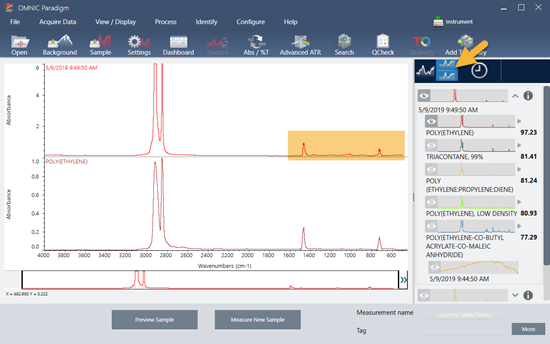
The spectral pane shows the sample spectrum along with the best matched spectrum from the selected libraries. The two spectra are overlaid with the same Y-axis scale so you can compare the results visually. (If the spectra are very similar, as in this case, there are other views that will highlight the differences. We’ll talk more about that later.) The results panel shows a list of the 5 best matched spectra, along with their match values.
Figure 3-4: Sample and top search result displayed together using the same Y-axis scale
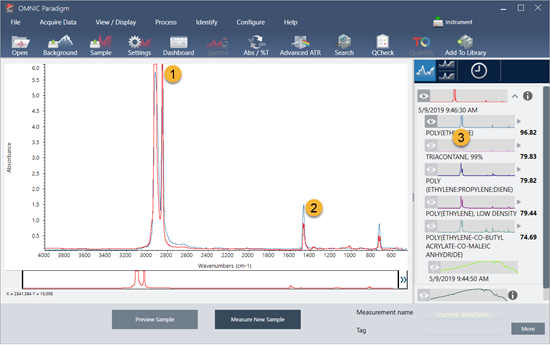
- Sample spectrum (red)
- Best match (blue)
- Results panel
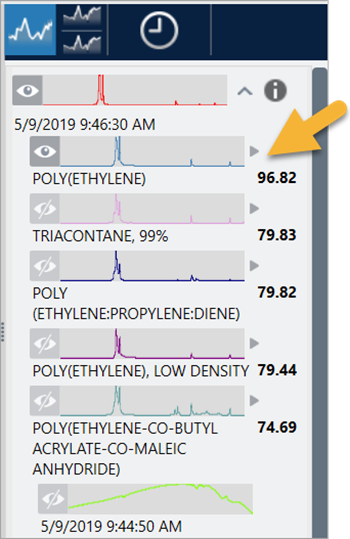
The match values tell you how well each library spectrum matches the unknown sample. The closer this value is to 100, the better the match.
In this example, the top match has a match value that is above 85, which indicates a good match. The match value for the next spectrum in the list is well below that.
Match values showing a clear match
If we look at the overlaid spectra in the spectral pane, the positions of the main peaks line up along the X-axis, and they differ only in their peak heights.
Overlaid spectra showing a clear match
Click the Stack button to see the two spectra scaled to fill each Y-axis. Again, the spectra are well matched except for the slightly raised baseline in the sample spectrum’s low frequency region. As a result, we can conclude that the sample is polyethylene and the analysis is complete.
Stacked spectra showing a clear match
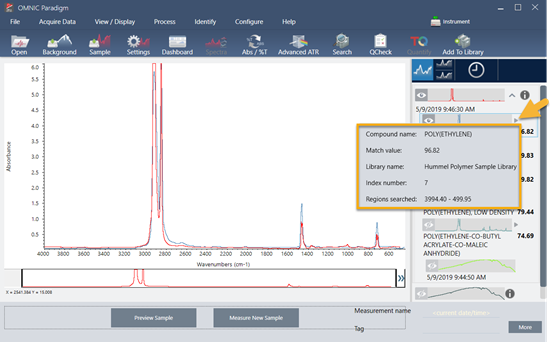
To get more information about a spectrum in the match list, including the library it came from and its identification number, hover over the spectrum’s grey arrow in the results panel.
Information button for a library spectrum
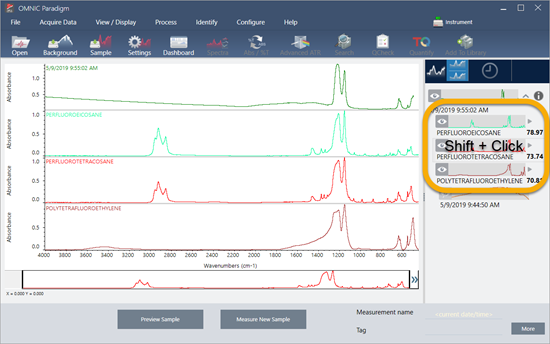
What if there isn’t a clear (single) match?
If the analysis results show several matches that all have similar match values, as in this example, Shift + click the three matches in the results panel to add all three spectra to the spectral pane for a detailed comparison.
Stacked spectra showing several similar matches
How can I improve my analysis results?
If no clear match appears, there are a number of options to consider that may improve your results. (Some setting adjustments will require a new background measurement.)
For starters, you can return to the dashboard and adjust the Resolution setting for the unknown sample. For example, you can acquire the spectrum at a higher resolution by using a lower Resolution setting. If the sample peaks are sharper or more numerous, you may get a better analysis result. You can also acquire more scans to reduce spectral noise, which can also affect the results.
If the sample spectrum has a tilted or curved baseline, try applying Automatic Baseline Correction (Process menu) to your sample spectrum. Then restart the analysis by choosing Identify (menu) > Correlation Search, or click the Search button on the toolbar.
How to specify the spectral region
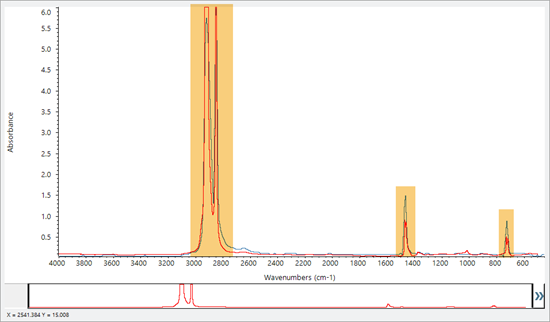
for the Analysis If your sample spectrum has a peak that is so large it is off the Y-axis scale, you may want to exclude that peak from your analysis. Here is an example:
Example of a totally absorbing peak
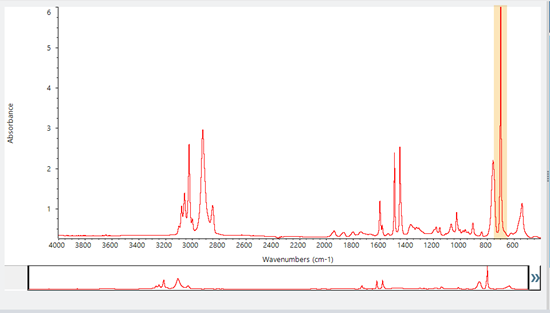
These “flat topped” peaks are referred to as “totally absorbing” and can contain excessive spectral noise, which affects the analysis results.
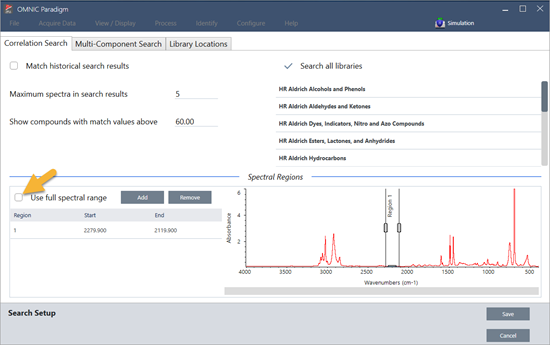
To exclude a totally absorbing peak, choose Identify (menu) > Search Setup and use the tools to select the regions to search.
First, clear the “Use Full Spectral Range” check box to enable the region tools.
Tools for selecting the regions to search
Then position the vertical bars to select the first region to search.
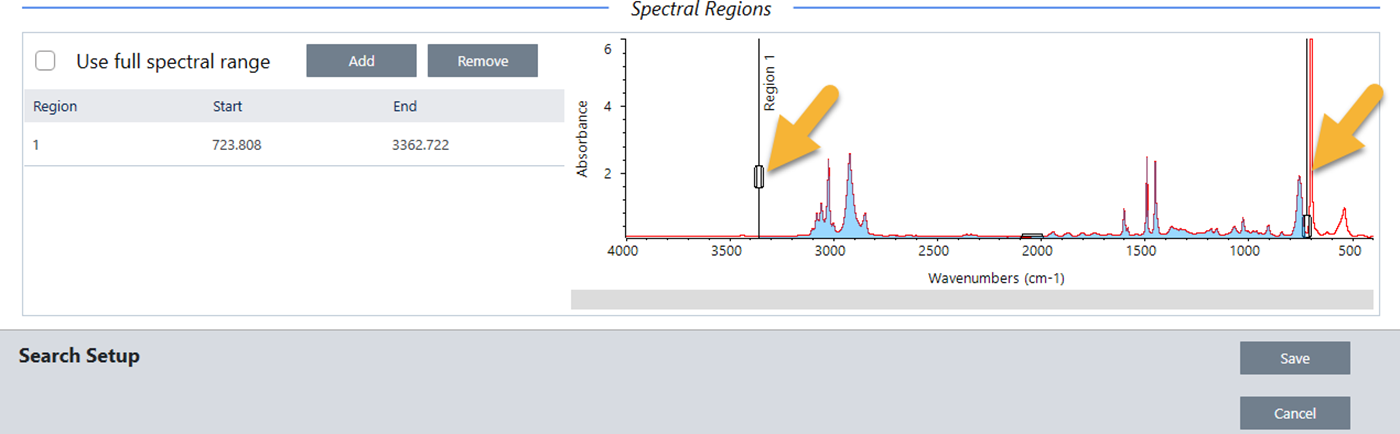
To add a search region, click the Add button and use the second set of vertical bars to select the next region. Here we used the first set of vertical bars to select the region to the left of the fully-absorbing peak. And then we added a region and used the second set of vertical bars to select the region to the right of the fully-absorbing peak.
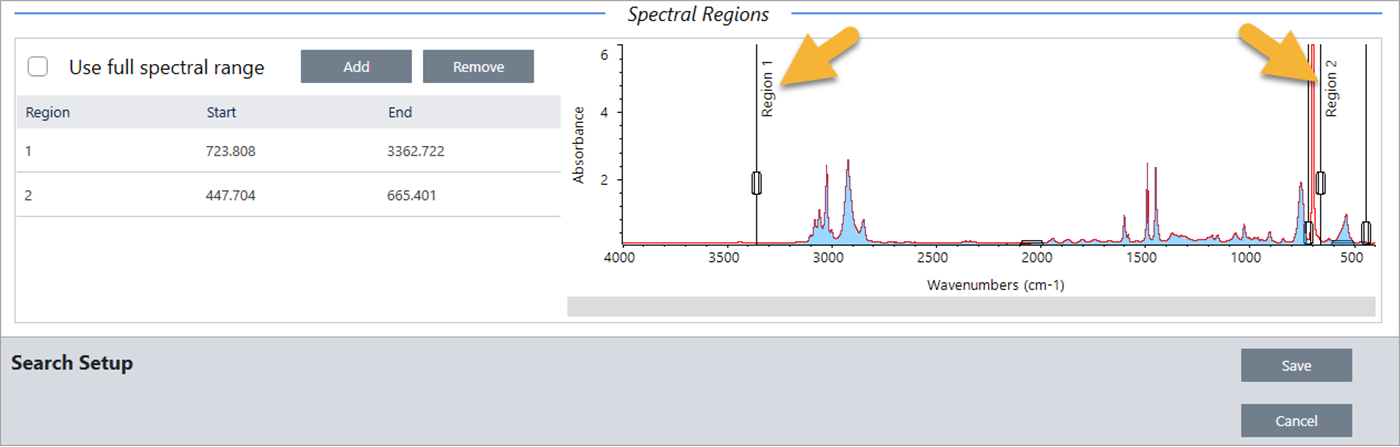
When you are finished selecting regions, click Save to return to the Dashboard view, and then click the Search button on the toolbar to re-run the search.