Identify Components in a Time Series Analysis
By performing an Identify Components search in a Time Series Analysis, you can quickly identify the primary components of a Time Series measurement, including a TGA sample that you measured using a Thermo Scientific TGA-IR module.
Setting up your Identify Components search
You can specify several settings for your Identify Components search. Options for the Identify Components search are similar to a multi-component search.
To set up the Identify Components search
-
To go the Identify menu and select Search Setup.
-
Go to the Time Series Component Search tab.
-
Change your settings as desired and select Save.
| Setting | Description |
|---|---|
| Maximum number of search results | Use this option to set the maximum number of composite results that the software will find. |
| Number of components | Use this option to set the number of components found in each composite result. |
| Search all libraries | Use this option to search all your libraries or only a subset of libraries. Including more libraries will make the search take longer. |
| Use full spectral range | Select to use the full spectral range for the search. Clear the selection to specify one or more limited ranges for the search. You can use multiple regions to exclude another region from the search. For example, include a region on either side of a totally absorbing peak to exclude it from the search. |
Using an Identify Components search
When your Time Series measurement is finished, go to the Search tab to start an Identify Components search.
To identify components
-
In the Time Series view, go to the Search tab.
-
From the Search type list, select Identify Components.
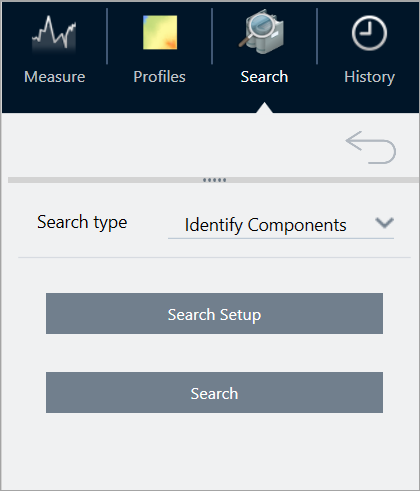
-
Select Search.
The Search begins and displays the results. How long the search takes depends on how many libraries you are searching and on how long your Time Series measurement was. If you have a long measurement and are searching many libraries, the search may take several minutes.
-
When the search is finished, interpret your results.
Example results from an Identify Components search
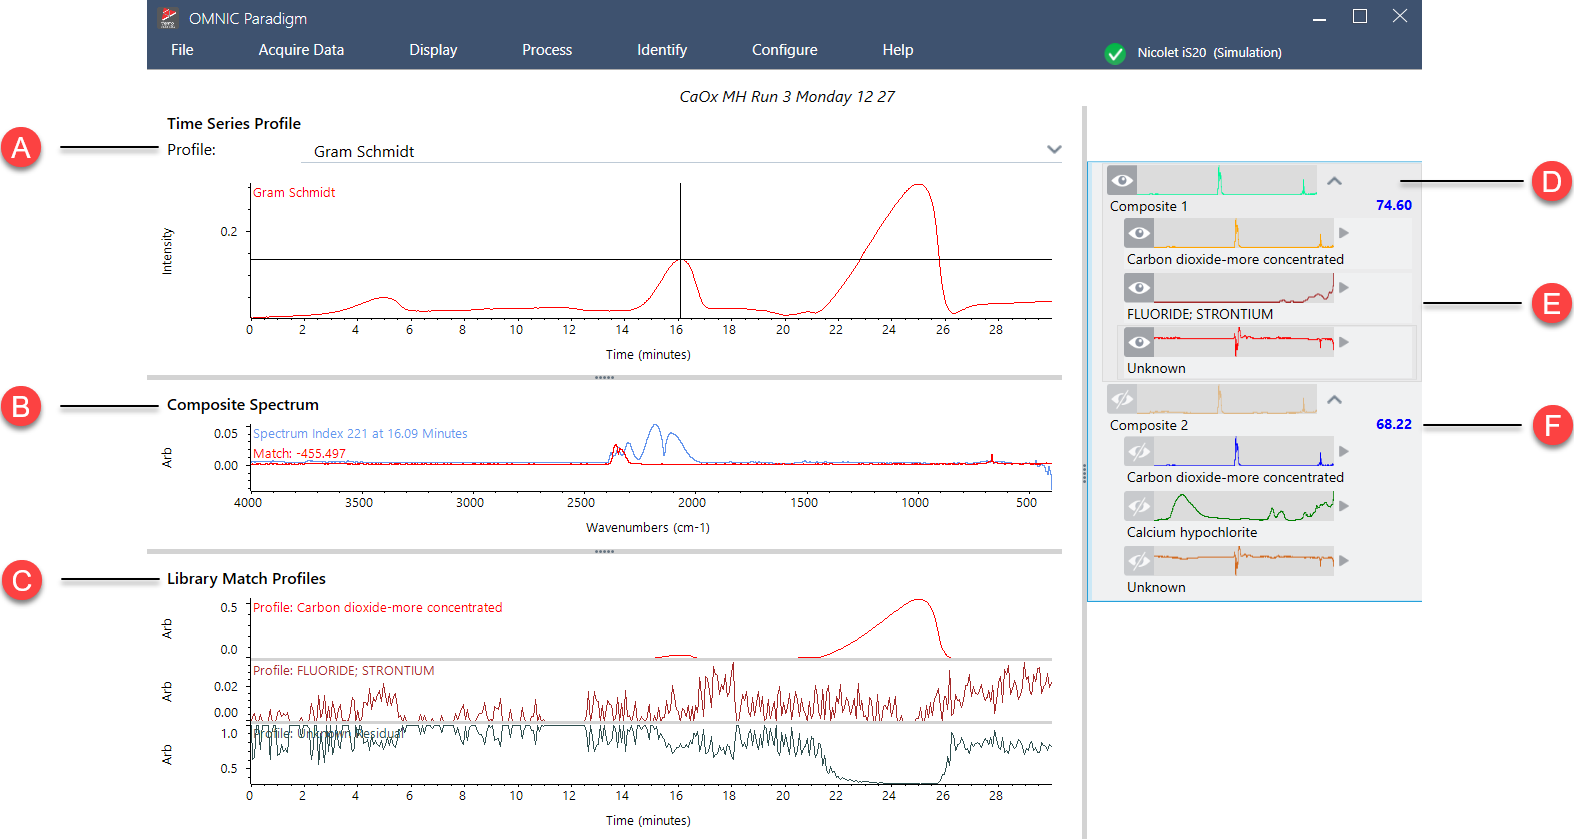
| A | The profile pane shows the combined spectral response for all components over the full duration of data collection. Select a profile from the Profile list to view it here. |
| B | The composite spectrum pane shows the spectrum linked to the selected decomposition time in the profile pane and the composite spectrum for the selected match at the same decomposition time. |
| C |
The library match profiles pane shows the spectral response for each primary found component over the full duration of data collection. This lets you see when each primary component vaporized from the sample. |
| D | The results pane shows the composites and the component spectra found in the search. The composite is a calculated representation of all references in the match set. The amount of each reference in the composite is based on the amount present in the component profile at the selected decomposition time. The selected spectrum is red. |
| E | The components contribute to the composite result. |
| F | The match value tells you how closely the match set fits all the spectra in the series data set. The higher the value is, the better the fit. |