Identify contaminants
If you have a known substance and you want to check for any other unexpected materials, use Contaminant Analysis. Contaminant Analysis compares a reference spectrum of your known material to the actual spectrum and identifies potential contaminants. Unlike QCheck, which compares your spectrum to a single reference spectrum and reports a match value and a pass or failure, contaminant analysis identifies likely contaminants in your sample.
The results of Contaminant Analysis show you what contaminants may be present and in approximately what quantity.
Setting up and using contaminant analysis
Contaminant Analysis is available in both the Desktop and Touchscreen interfaces.
Contaminant Analysis in the Desktop interface
❖ To use contaminant analysis
- Assign a reference spectrum in Search Setup.
- Go to Identify > Search Setup.
- Select the Contaminant Analysis Search tab.
- Select a reference spectrum. This is the spectrum of your known material.
- Review your other settings.
- Click Save.
- In Spectra view, select the spectrum to analyze.
- Go to Identify > Search > Contaminant Analysis.
After a short time, the spectra view shows the results of the analysis.
Contaminant Analysis in the Touchscreen interface
❖ To use contaminant analysis
- Assign a reference spectrum in Search Setup.
- Open the main menu and select Search Setup.
- Select the Contaminant Analysis Search tab.
- Select a reference spectrum. This is the spectrum of your known material.
- Review your other settings.
- Select Save.
- In Spectra view, select the spectrum.
- Open the main menu and select Search > Contaminant Analysis.
After a short time, the spectra view shows the results of the analysis.
Contaminant analysis settings
| Setting | Description |
|---|---|
| Max number of results |
Set how many composite results are returned. For example, if you set 2 results, the contaminant analysis will show you 2 possible composites ordered by match value. |
| Number of contaminants |
Set the number of compounds in each composite. For example, with 3 contaminants, in your results, each composite spectrum will include 3 possible contaminants. |
| Select all libraries | Select which libraries to use in the search. Using fewer libraries speeds up the analysis. |
| Search reference source | Indicate if your reference spectrum is in a library or if it is a standalone measurement in your database. |
| Select reference | Your known compound. In the contaminant analysis results, each composite will include your known compound and suspected contaminants. |
| Use full spectral range | Limit the range or use the full spectrum in the analysis. |
Interpret the results
Like other Search analyses, the results of the Contaminant Analysis are displayed in the Spectra view. The Results pane lists each composite and potential contaminants.
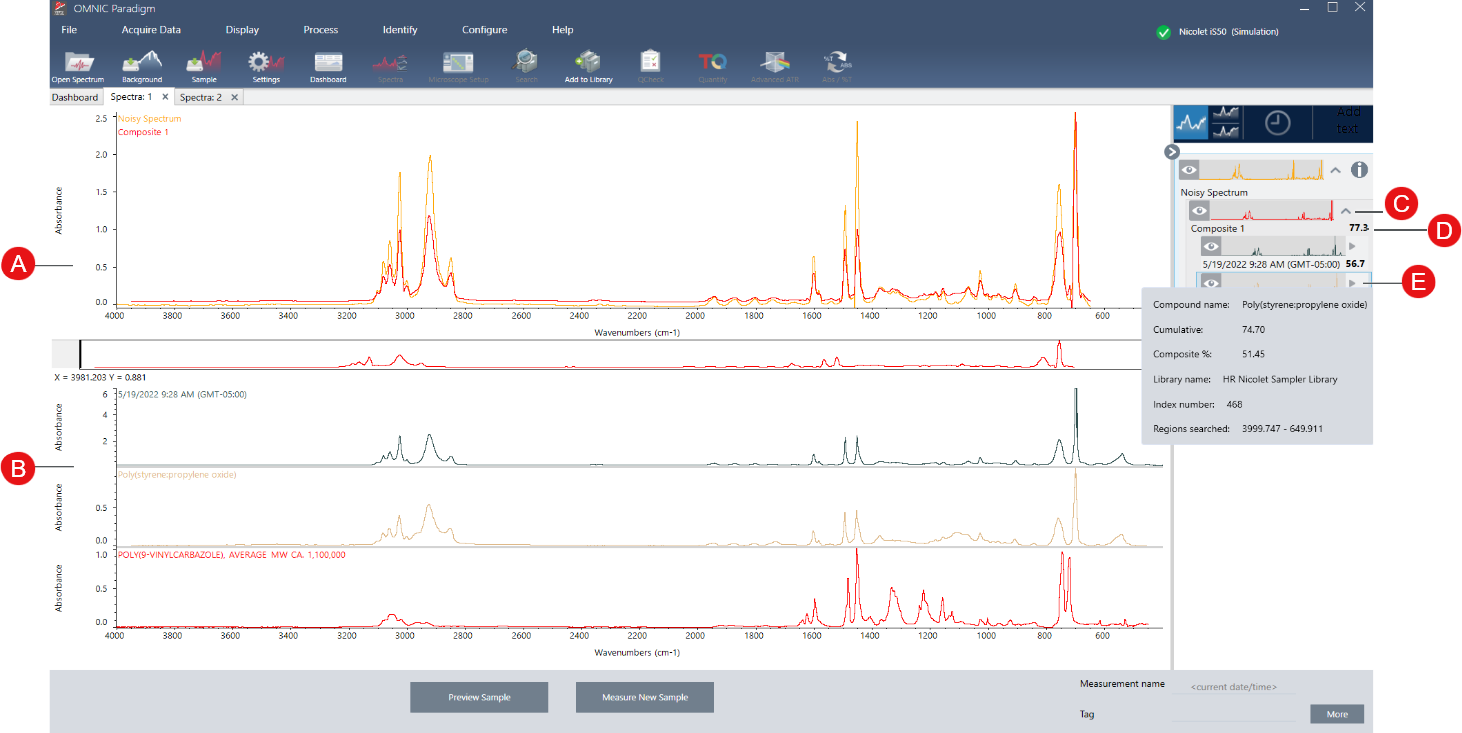
| Feature | Description |
| A | The sample spectrum and the composite spectrum |
| B | Spectra of the compounds in the composite, including the known compound |
| C | Show or hide the details of the composite |
| D | The composite match value shows how well the composite spectrum matches the sample, with 100 representing a perfect match. |
| E | Hover over the gray arrow to view details about each of the compounds. |
Details about each compound include the following:
| Compound name | The name of the compound |
|
Cumulative |
The cumulative value shows how each component contributes to the overall composite match value. The cumulative value for the first component shows its contribution to the overall match, and each additional component’s contribution adds to the overall match value. For example, consider a composite with a match value of 80, including a compound with a cumulative of 70 and a compound with a cumulative of 80. In this case, the first compound contributes 70 to the match value and the second compound contributes another 10 to the match value. |
| Composite % |
The composite percent value indicates the amount of the reference compound in the composite. For example, a composite value of 55% means the component contributes 55% to the total composite spectrum. The sum of the composite percent values is always 100%. Note that the composite percent value shows the contribution of the compound to the composite, not to the actual sample. In other words, a composite value of 55% for a found component does not necessarily mean the sample mixture contains 55% of that component. |
| Library name | The name of the library in which the compound was found |
| Index number | The location of the compound in the library |
| Regions searched | Spectral regions used in the library search |
Attachment(s):
| File | Last Modified |
|---|---|
| Identify contaminants_1.png | July 08, 2022 |