Identify unknown material in a Time Series measurement
Use the Identify Time Series Peaks search to quickly identify unknown material in a time series sample. This tool is like GC Identify with Mercury GC in OMNIC Series software.
Comparison of Time Series Searches
-
Identify Time Series Peaks: This search finds peaks in the profile and then does a correlation search on the spectrum at each peak, providing a list of best matches for every peak it identifies. This is useful for telling you what materials appear at specific times in the measurement. Use this search when your profile has distinct peaks, such as during a GC-IR measurement.
-
Identify Components: This search is like running a multi-component search across the entire time series measurement. The search returns a composite spectrum and the profile of each of the library matches, showing you the gradually changing response of each of the major components. This search is useful when your profile has more gradual changes, such as in a TGA-IR measurement.
The analysis duration depends on the number of reference libraries selected, the size of each library, and the number of response peaks in the series Gram-Schmidt profile.
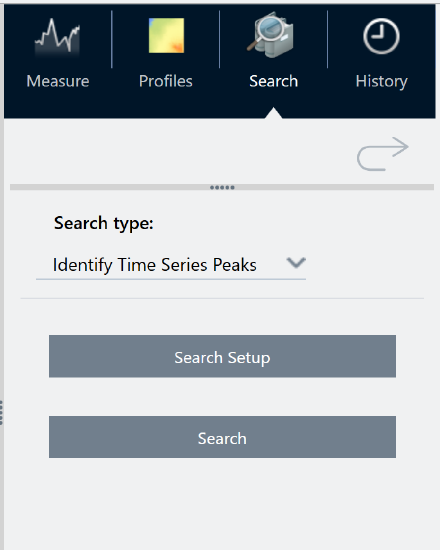
Use the Identify Time Series Peaks search
To use the Identifying Time Series Peaks search
-
When your time series measurement is complete, select a profile in the Profiles tab. By default, the Gram-Schmidt profile is used, but the search uses whichever profile you currently have selected.
-
Go to the Search tab.
-
In the Search type list, select Identify Time Series Peaks.
-
Select Search Setup to review your search settings. Save your settings to return to the analysis view.
-
Select Search.
Identify Time Series Search Settings
|
Search all libraries |
Select which libraries you want to include in the search. Using more libraries will make the search take longer. |
|
Use full time range |
Select to include the entire duration of the measurement in the search or clear the selection to only use specific time ranges. |
|
Use full spectral range |
Select to include the entire spectral range or clear the selection to limit the spectral range in the search. |
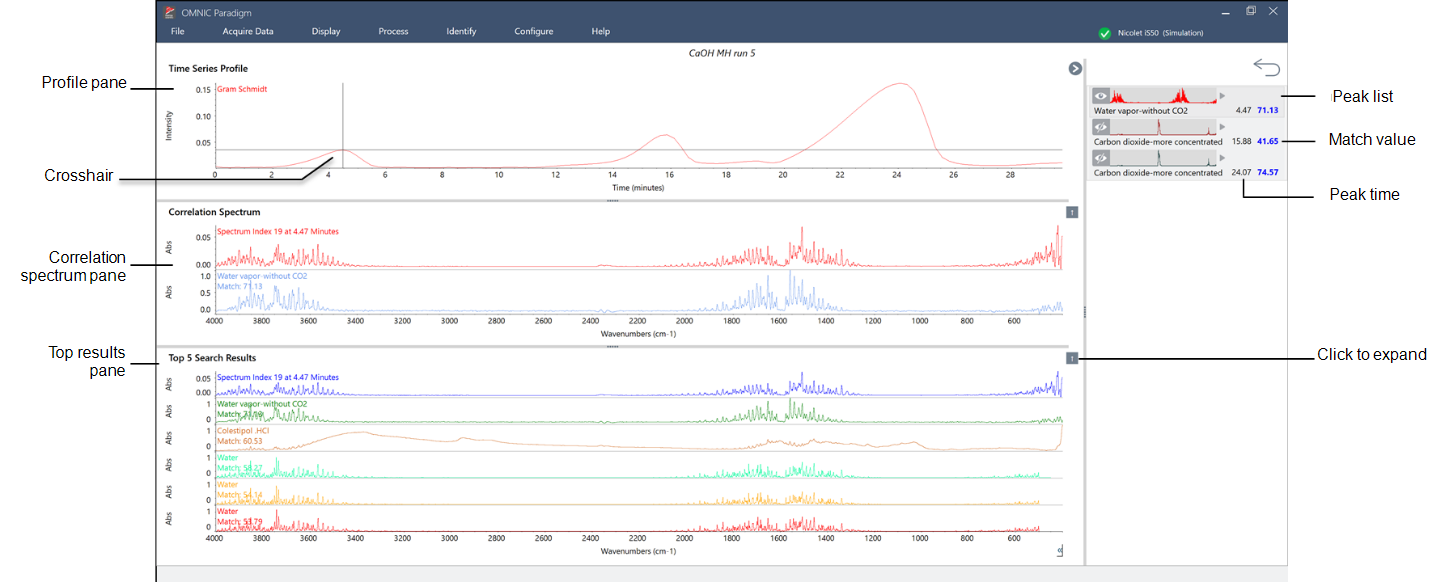
Interpret your results
The results view is divided into four main areas:
|
The profile pane |
Shows the Gram-Schmidt profile or the custom profile used in the search. The crosshair indicates the currently selected time. |
|
The correlation spectrum pane |
The top spectrum shows the actual spectrum at the selected time. The bottom spectrum shows the library spectrum that best matches at this time. |
|
The top results pane |
This area shows the top matches at the current time, with the best match at the top. To move another result to the correlation spectrum pane, right-click one of your results and select Make selected result the top hit. This makes it easier to compare other results to the measured spectrum. |
|
The peak list on the right |
This panel shows the best match at each identified peak, including the retention time and the match value. |