Quantify Sample Composition
Find the concentrations of components in your sample using a Quantify analysis. A Quantify analysis uses a previously created quantitative analysis method and reports the concentration of components in the sample or other kind of information, such as peak height or match value.
This guide walks you through setting up and running a Quantify analysis using the desktop interface of OMNIC Paradigm software.
PREREQUISITES
This guide assumes that you have already set up your instrument and sampling accessory. For instructions on installing a sampling accessory, see the documentation that came with your instrument.
You will also need a valid quantification method saved as a QNT file. The quantitative analysis method must be calibrated using Thermo Scientific TQ Analyst software. See the documentation that came with that software for information on calibrating quantitative analysis methods.
Performing a Quantify analysis
Running a Quantify analysis requires you to import a QNT file, review your measurement settings, measure the background, and finally measure your sample. When analysis is complete, you can create a report to save or share your results.
❖ To perform a Quantify analysis
-
Set up the analysis.
-
On the dashboard of the desktop interface of OMNIC Paradigm software, confirm that the settings display your sampling accessory.
-
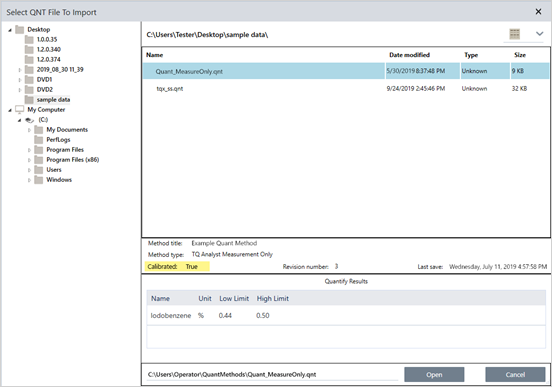
Navigate to Identify > Quantify Setup and browse to the QNT file you would like to use in the analysis.
The file explorer displays additional information about the QNT file that you have selected, such as the method title, method type, and whether the method has been calibrated.
-
To import the method, click Open.
-
In the Analysis type list, select Quantify. A symbol indicates that you have imported a valid QNT file. A red circle with an X indicates that a valid method has not been imported.
When selecting a QNT file, the file explorer displays additional information to help you make a selection, including the method title and type and whether the method has been calibrated. Only methods that have been calibrated with TQ Analyst software are valid.
-
-
Measure the background.
Before measuring your sample, you need to have a current measurement of the background.
The background spectrum is used to eliminate any signals in the sample data that are due to the spectrometer, the sampling accessory, or the background environment.
- Click Preview and Measure Background.
- Click Start Background Measurement. When the background measurement is complete, the spectrum is added to the results panel.
-
Measure the sample.
- Load your sample. For instructions on loading a sample, see the documentation that came with your instrument or sampling accessory.
- Click Preview Sample. The Sample Preview displays a live preview of your sample spectrum. The preview gives you the opportunity to correct any potential issues before measuring the sample.
- When you are ready to continue, click Start Sample Measurement.
-
Interpret your results.
When the sample measurement is complete, the Quantify dialog box displays results of the analysis. The results shown depend on the settings in the quantitative analysis method used in the analysis. The results shown below show a measurement only result indicating a passing value.
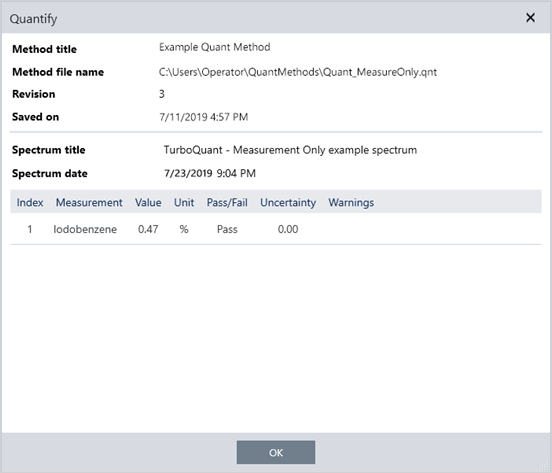
After clicking OK to close the Quantify dialog box, you can view the analysis results by clicking the information icon next to the spectrum in the results panel. In the Spectrum Information dialog, navigate to the History tab and see the Quantify Results section.
-
Create a report
When you are finished with your analysis, create a report to export your results to Microsoft™ Word™, PowerPoint™ or Excel™ or to print or save your results.
- Navigate to File > Create Report.
- Give your report a title.
- Select a format from the Format list and choose the Quantify template. A preview of the report is shown in the right panel.
- Click Create.
Improving your results
If your results are unclear or problematic, there are several options to consider that may improve your data.
- Return to the dashboard and adjust the Resolution settings for your measurement. For example, you can measure the sample at a higher resolution by selecting a smaller value, such as 1 or 2. If the sample peaks are sharper or more numerous, you may get a more accurate analysis result.
- Increase the number of scans in your measurement, which may reduce spectral noise.
- If the sample spectrum has a tilted or curved baseline, try applying Automatic Baseline Correction to your sample and then restart the analysis from the Identify menu. Thermo Scientific OMNIC Paradigm Software with Microscopy User Guide 78
Next steps
In this guide, you set up and ran a Quantify analysis.
Next, see "Create and Run Your First Workflow" for a guided tutorial on using workflows to create routine, repeatable procedures.