Working with the FT-Raman view
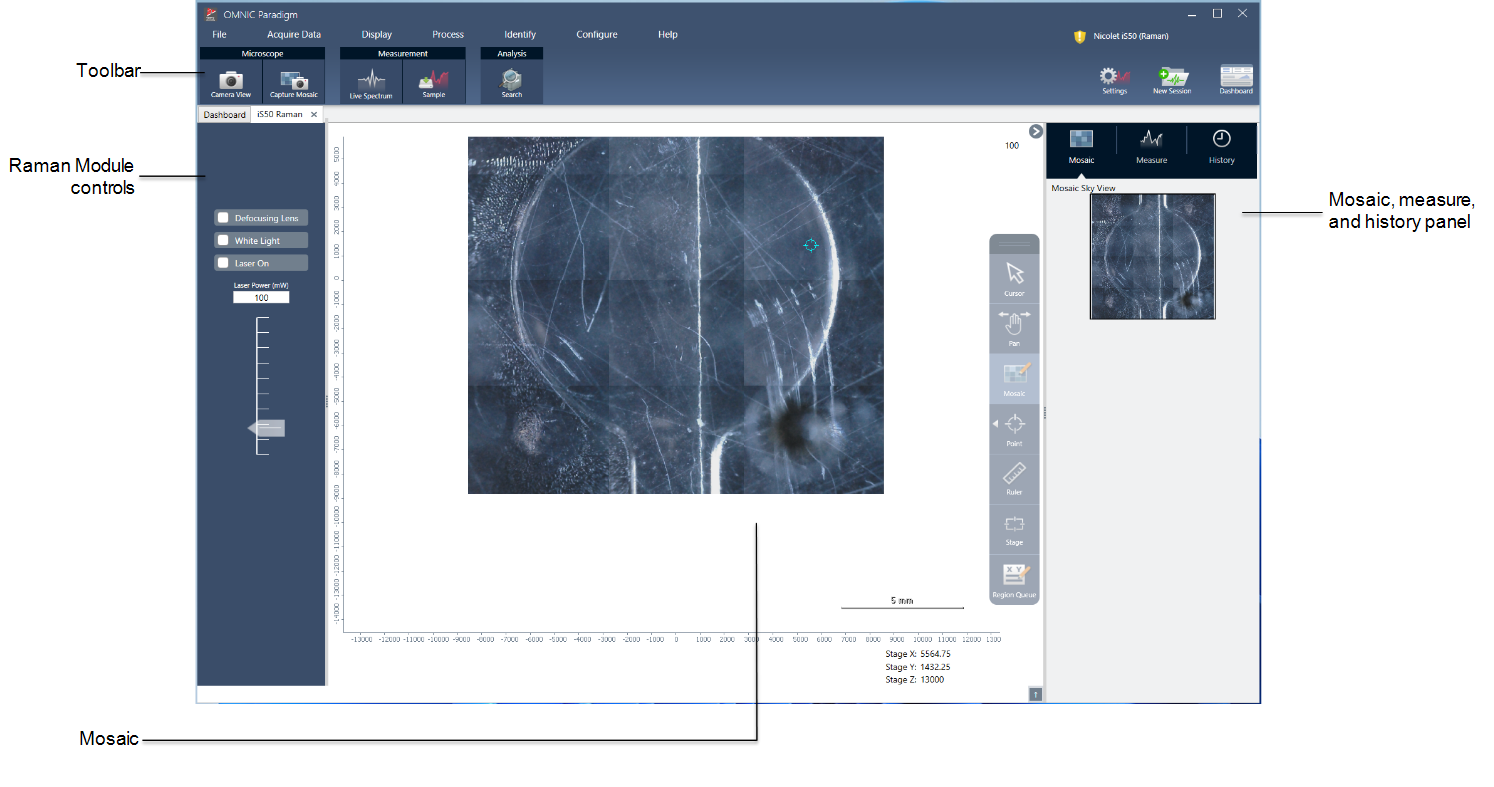
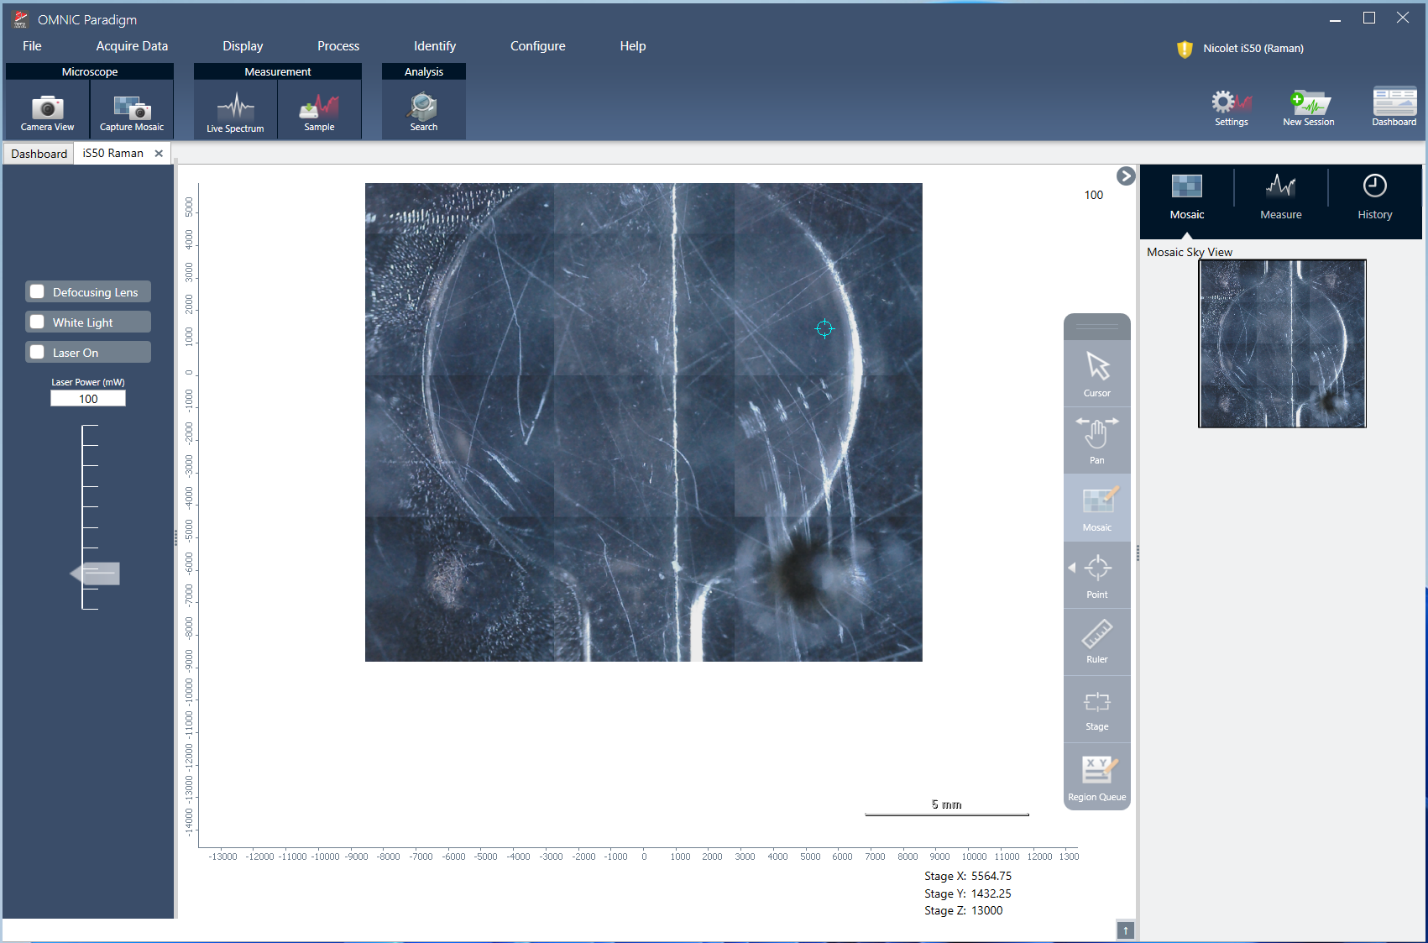
When you start an FT-Raman session, the acquisition tab opens and displays the Raman acquisition view. This view is divided into four main areas: The toolbar, the Raman Module controls, the mosaic, and the mosaic, measure, and history panel.
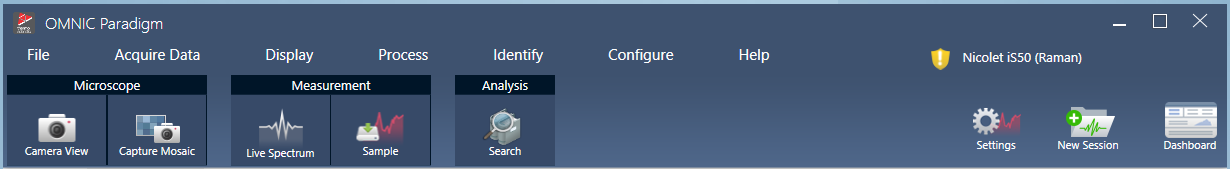
Toolbar
The toolbar contains tools for viewing your sample and spectral data.
-
Camera view: Toggle the live camera view to see the camera image of the sample and to move the stage.
-
Capture mosaic: Select to capture the images that are stitched together to become the mosaic image.
-
Live spectrum: Toggle the live spectrum view. Use this tool to view the signal at the current stage location.
-
Sample: After placing your sample points, select this tool to start your sample measurement.
-
Search: Perform a correlation search on the currently selected measurement.
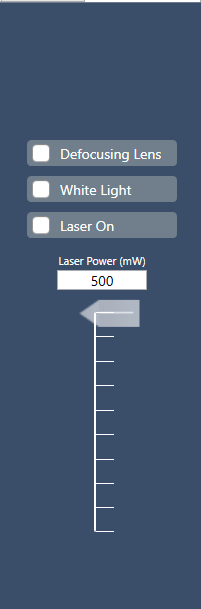
Raman Module controls
This panel contains tools for the laser and light in the Raman module. For more information about using these settings and tools, see the Raman Module user guide.
-
Defocusing lens: Select to turn on the defocusing lens.
-
White light: Select to toggle the white light source.
-
Laser on: Select to turn the laser on.
-
Laser power: Use the slider to control the laser power.
Mosaic
A mosaic is a visual image of your sample surface. The camera captures a series of small, high-resolution images and stitches them together into a single mosaic, giving you a large image of the sample surface that you can use for your analysis. The mosaic acts as a workspace for your analysis, where you can explore regions of interest and specify areas and points for your data collection.
-
Stage position: These coordinates display the exact position of the stage.
-
Floating toolbar: This toolbar contains tools for working with the mosaic image. Here, you can find tools to move the image or the stage, indicate your measurement points, and more.
|
|
Cursor |
Use the Cursor tool to select points and regions on the mosaic. |
|
|
Pan |
Use the Pan tool to move the mosaic image and to view different areas of the sample.
|
|
|
Mosaic |
With this tool, you can draw an area to add to the mosaic. Select Capture Mosaic after drawing the area. |
|
|
Point |
Click the mosaic to add a collection point. You can add one or many to your measurement and you can view details about each point in the region queue. |
|
|
Ruler |
Click and drag to draw a line to measure features of your sample. The measurement length is displayed near the stage coordinates. |
|
|
Stage |
Use this tool to move the stage. Click a place on the mosaic to move the stage to that location.
|
|
|
Region Queue |
The region queue shows you information about all the measurement regions or points you have indicated on the mosaic. |


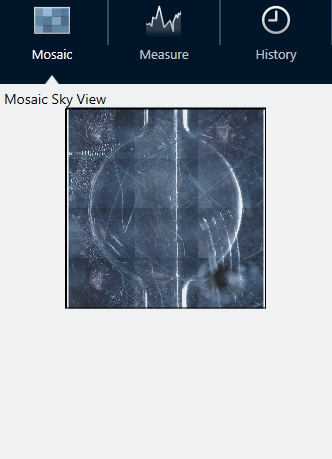
The mosaic, measure, and history panel.
-
Mosaic tab: Shows the sky view of the mosaic. You can use this tool to zoom and to navigate the mosaic image.
-
Measure tab: The measure tab shows you the list of regions or points that have been measured. Select a measurement to view the spectrum and to highlight the point on the mosaic.
-
History tab: The history tab lists processing steps and other changes that have been carried out so that you know how the data has changed since the original measurement.
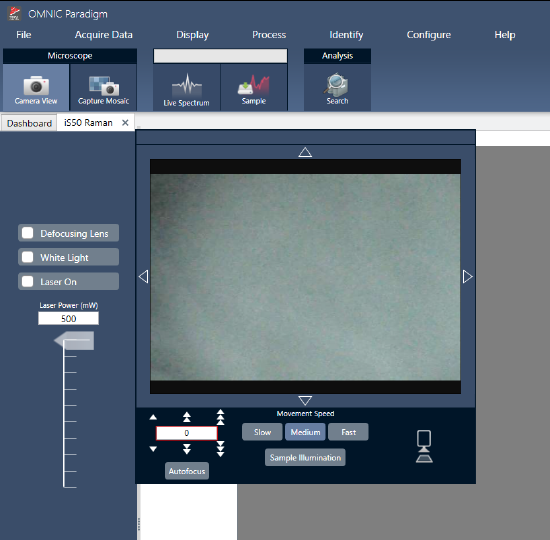
Using the Camera view with the Raman module
Use the camera view to control the visual image of the sample and bring the sample into focus.
-
Movement controls: Select the arrows around the visual image to move the stage in that direction.
-
Speed: The speed determines how quickly the stage moves. Use Slow for very fine movements.
-
Sample illumination: Toggle the light to view the sample.
-
Stage height and autofocus: Use the stage height arrows to move the stage up or down. You can also enter an exact value if you know the precision position to move the stage to. Select autofocus to automatically bring the visual image into focus.
-
Capture snapshot: Select to save a single snapshot image of the sample as it is displayed in the camera view.
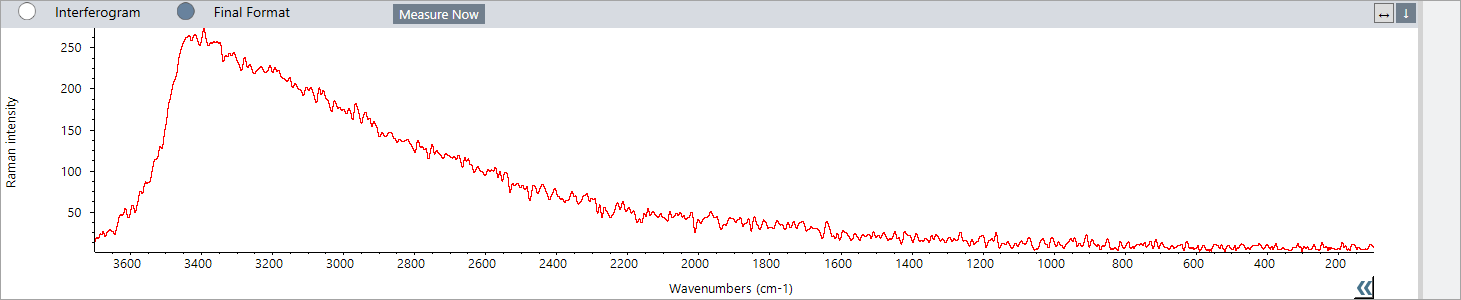
Live spectrum view
The live spectrum view displays the live signal at the current stage position. You can view the interferogram or the final format spectrum. Select Measure Now to measure and save the spectrum at this location.