Navigating the software
OMNIC Paradigm software has three possible views:
-
Desktop: Used for in-depth processing and analysis.
-
Touchscreen: Used for streamlined measurements and routine analysis.
-
Operator: Used for running workflows in custom packages.
Each of these views has a primary starting point where you can begin your analysis and view recent work.
Switching between interfaces
Although desktop and touchscreen software are optimized for different tasks and devices, you can switch between interfaces at any time.
❖ To switch between the touchscreen and desktop interfaces
-
To switch from desktop to touchscreen, select Configure > View > Touchscreen.
The software will close briefly and re-open with the touchscreen interface.
-
To switch from touchscreen to desktop, from the home screen, select Switch to Desktop from the menu.
The software will close briefly and re-open with the desktop interface.
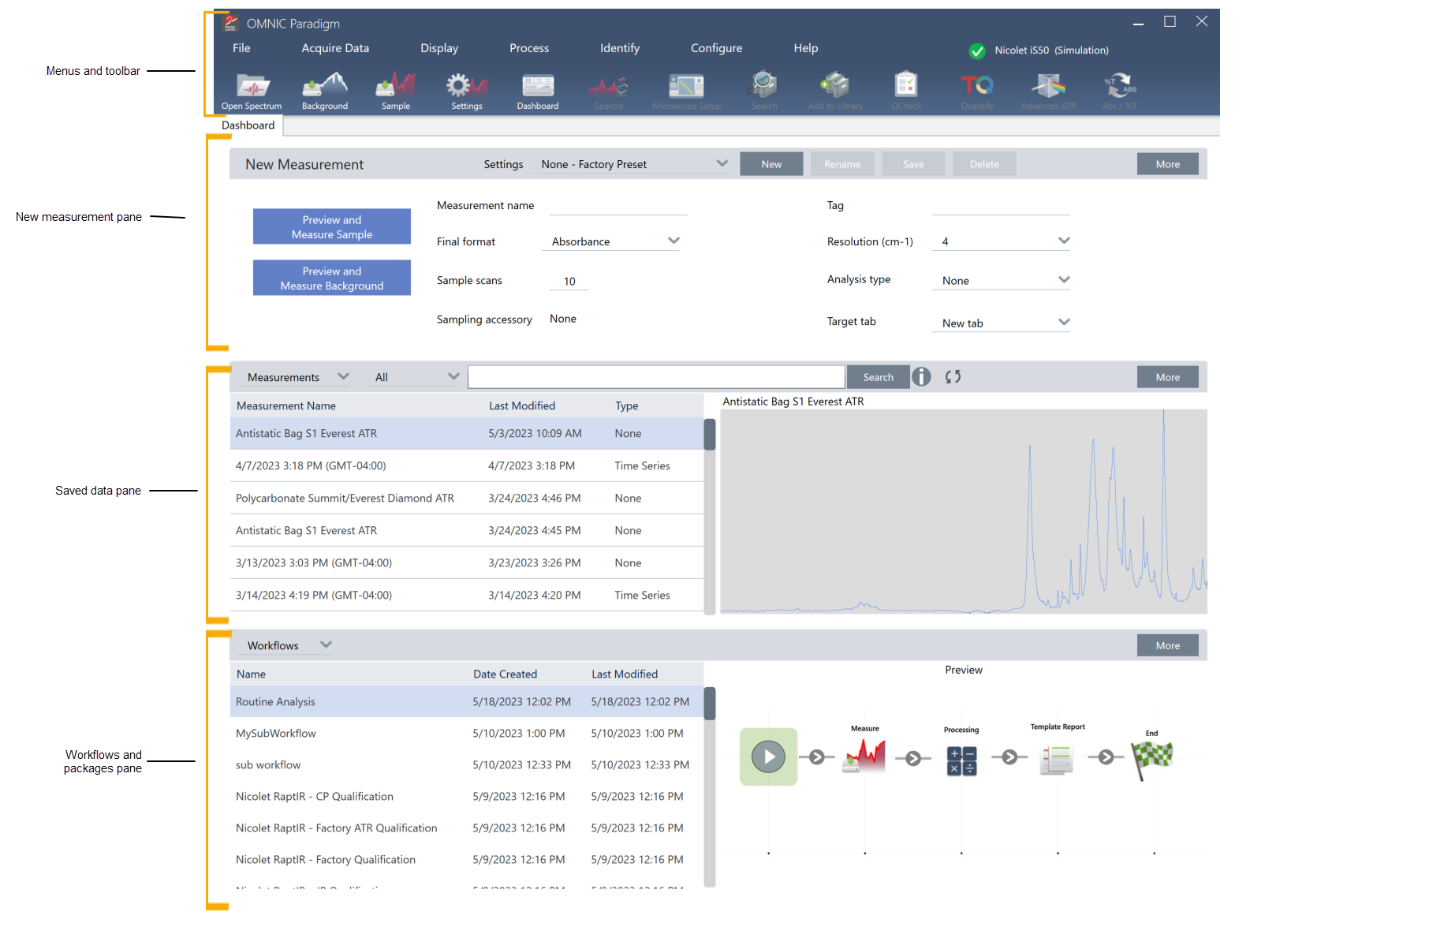
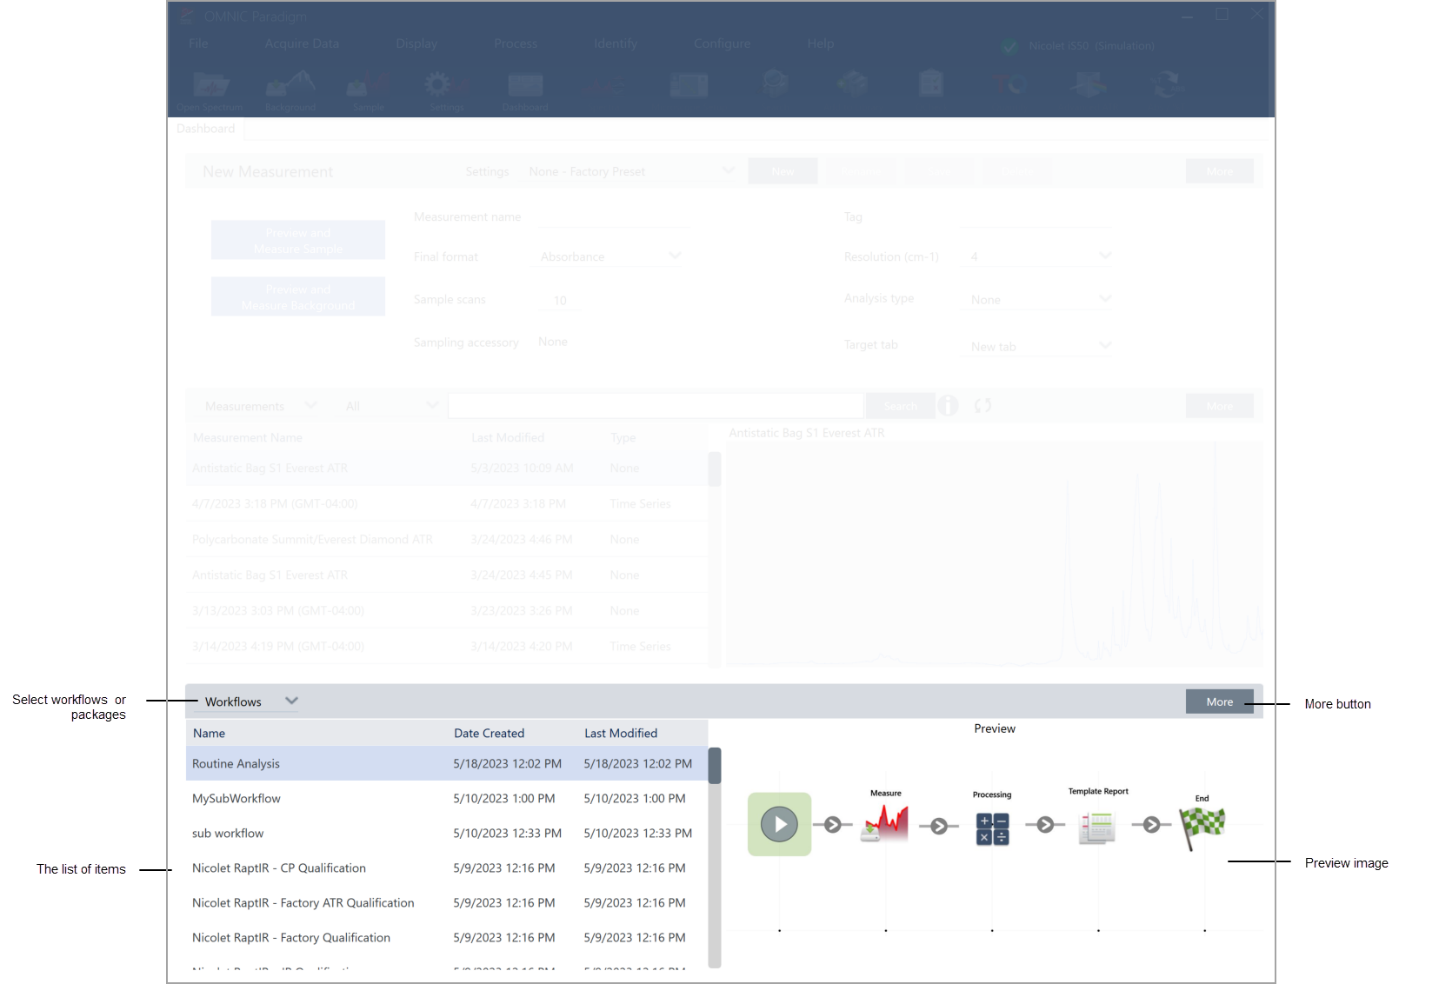
The Dashboard (Desktop view)
When you are using the Desktop view, your analysis starts on the dashboard. This is where you can easily access frequently used settings and view your recent measurements and workflows.
The dashboard is divided into four primary areas:
-
The menus and toolbar: Includes the menus, frequently used tools, and the system status.
-
The New Measurement pane: Select your measurement settings and start a new measurement.
-
The measurements and reports pane: Sort, filter, and find your previous measurements and saved data, including measurements, reports, sessions, and time series data.
-
The workflows pane: Where you can view your workflows and packages.
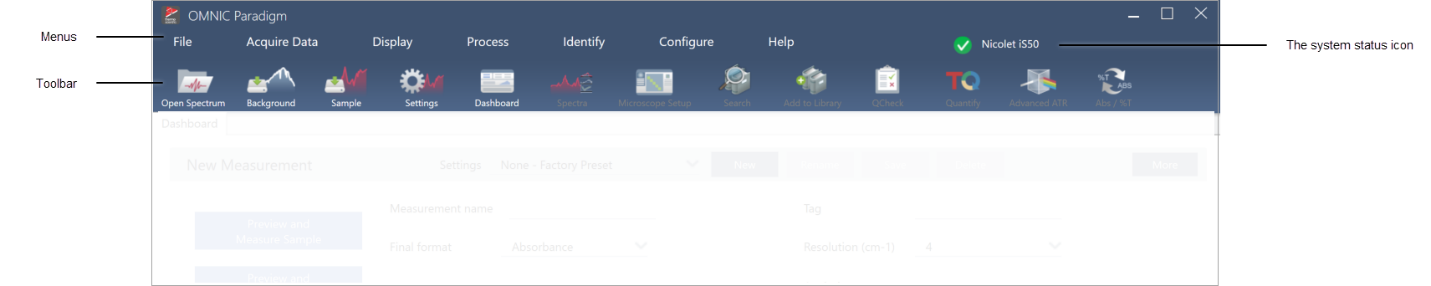
Menus and toolbar
|
Component |
Description |
|---|---|
|
Menus |
Use the menus to find features and tools |
|
Toolbar |
The Toolbar provides quick access to frequently used tools, and you can use it to navigate between views, such as the Dashboard and Spectra views. |
|
The system status icon |
The system status icon shows the status of the system and alerts you to potential issues. |
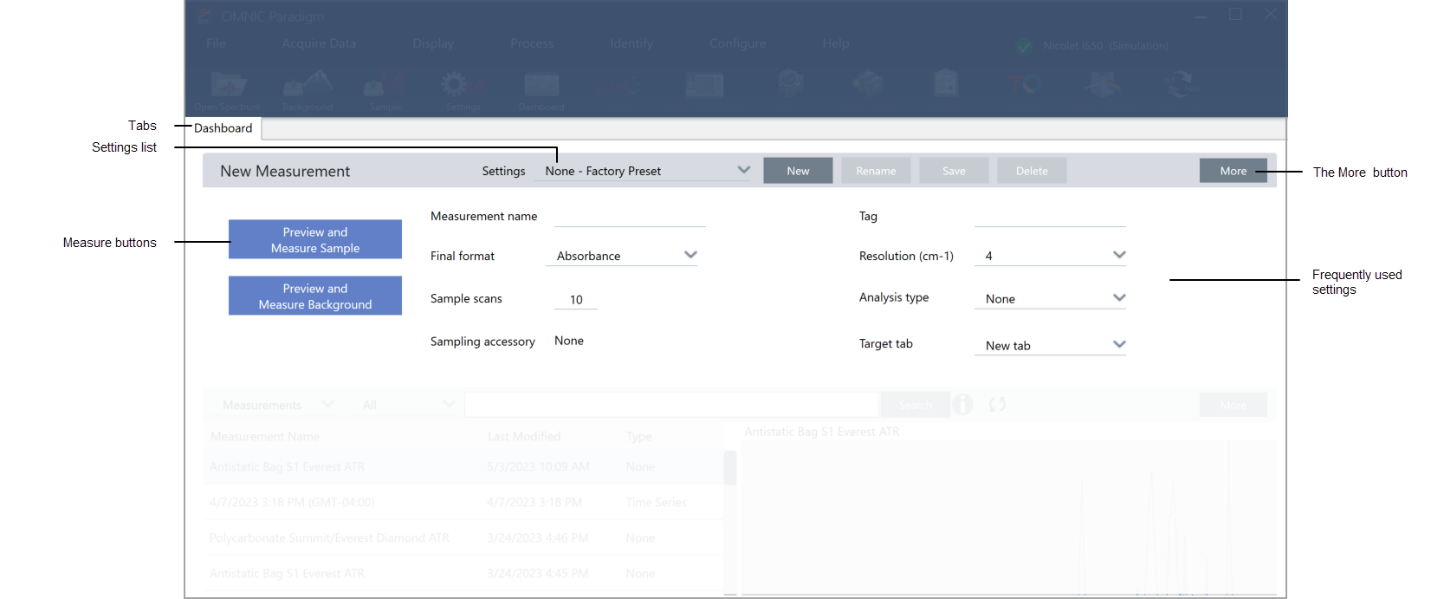
New measurement pane
The New Measurement pane is where you edit your measurement settings and start your new measurement. Click More to view other settings and to view the live interferogram or single beam spectrum.
|
Component |
Description |
|---|---|
|
Tabs |
This area shows your open tabs. |
|
Settings list |
The Settings list includes factory-created settings and settings that you have created. The list shows only those settings that are associated with the currently installed sampling accessory. |
|
Measure buttons |
Select these buttons to preview and measure the sample or background. |
|
The More button |
In each section, you can select More to view more information and access additional tools and settings. Here, select More to view more settings and to view the live interferogram or single beam spectrum. |
|
Frequently used settings |
You can find the most frequently needed settings here. Select More to see advanced settings. |
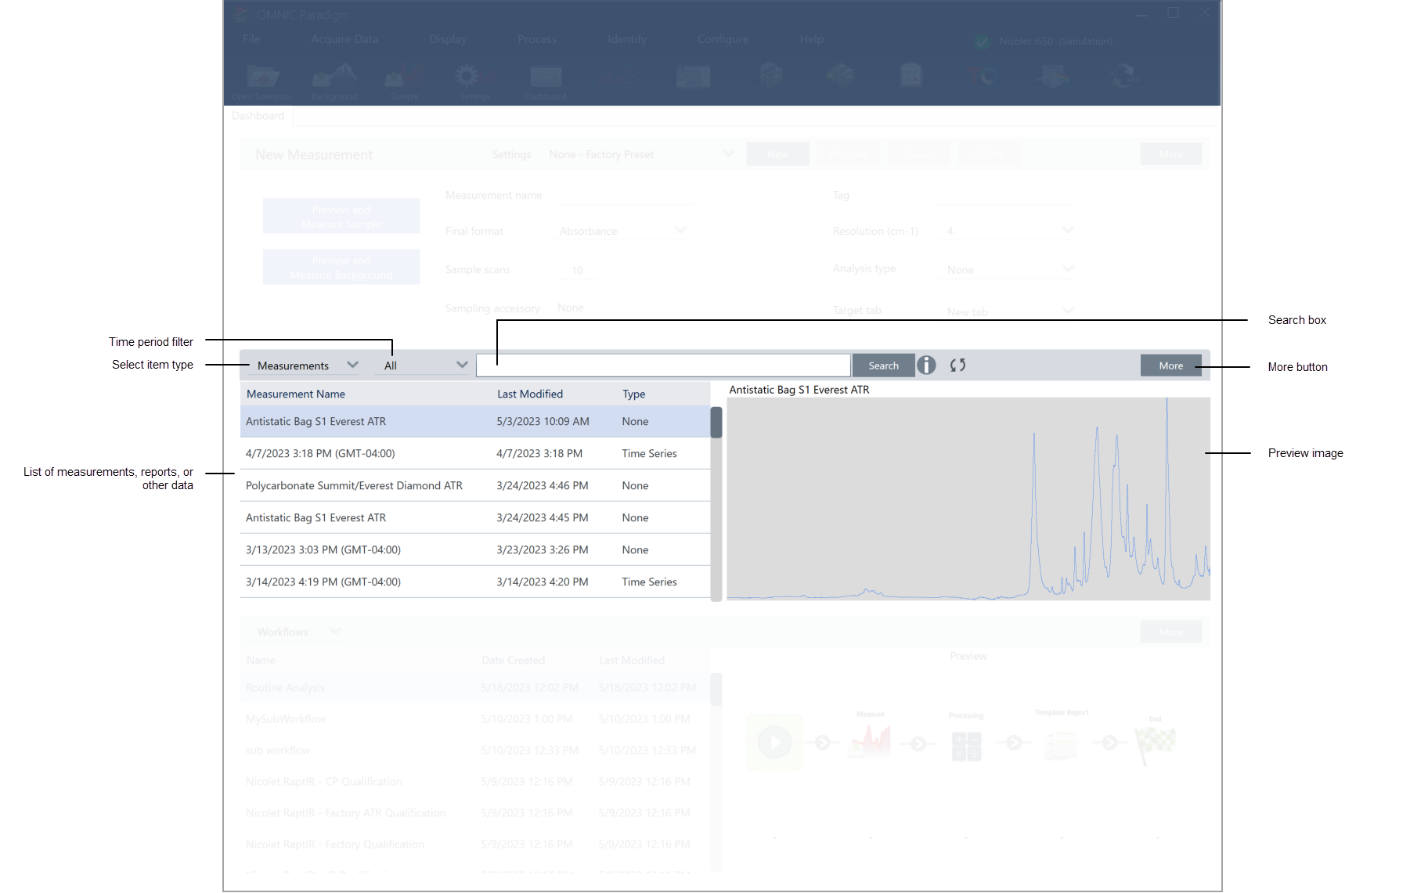
Previous measurements pane
This area shows your previously measured data, including measurements, reports, sessions, and time series data.
|
Component |
Description |
|---|---|
|
Time period filter |
Use to filter the list of data by age. |
|
Select item type |
Show measurements, reports, sessions, or time series data. |
|
List of data |
This area shows the actual data. Select the column header to sort the list by that column. For example, select Last Modified to sort the list from oldest to newest or newest to oldest. |
|
Search box |
Use this search box to find individual records. Explore “Finding Measurements and Reports” to learn more about searching and tagging. |
|
More button |
Select to view more information about your data. |
|
Preview image |
Shows a preview image of the data. |
Workflows and packages pane
The final pane on the dashboard shows your workflows and packages.
|
Component |
Description |
|---|---|
|
Select workflows or packages |
Choose whether to see workflows or packages |
|
List of data |
This area displays your list of workflows or packages. Like the measurements pane, you can select the column header, such as Date Created, to sort the records by that facet. |
|
More button |
Select More to expand this pane. |
|
Preview image |
This area shows a preview image. Locked workflows or packages, such as the qualification workflows, show only a logo. |
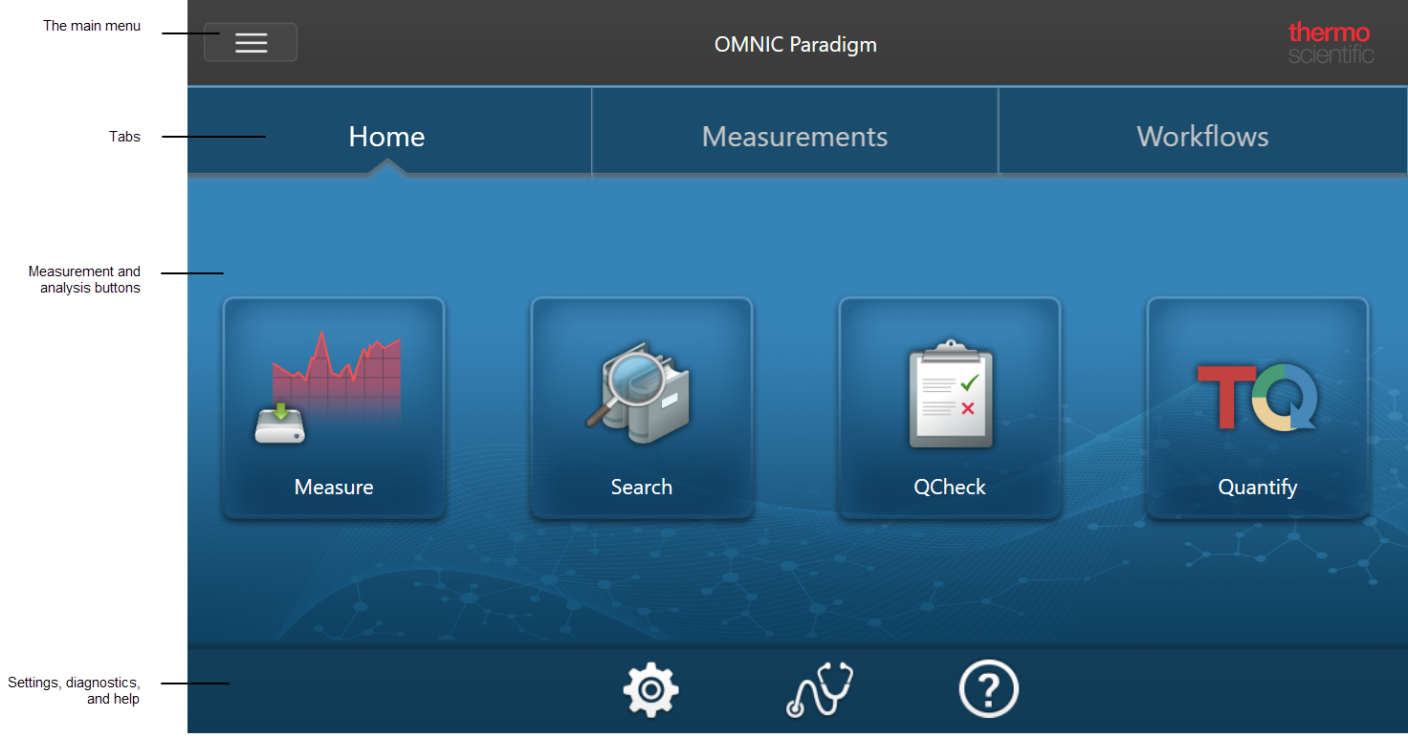
The Home Screen (Touchscreen view)
When you are using the Touchscreen view, your analysis begins on the home page. Here you can start a new measurement or view your previous measurements and workflows.
|
Component |
Description |
|---|---|
|
Main menu |
The main menu provides access to more features and tools and changes depending on what part of the software you are using. For example, the menu has different options when you are visiting the Home screen than it does when you are viewing spectra. |
|
Tabs |
Use these tabs to navigate. |
|
Measurement and analysis buttons |
Select one of these four options to begin your analysis. |
|
Settings, diagnostics, and help |
|
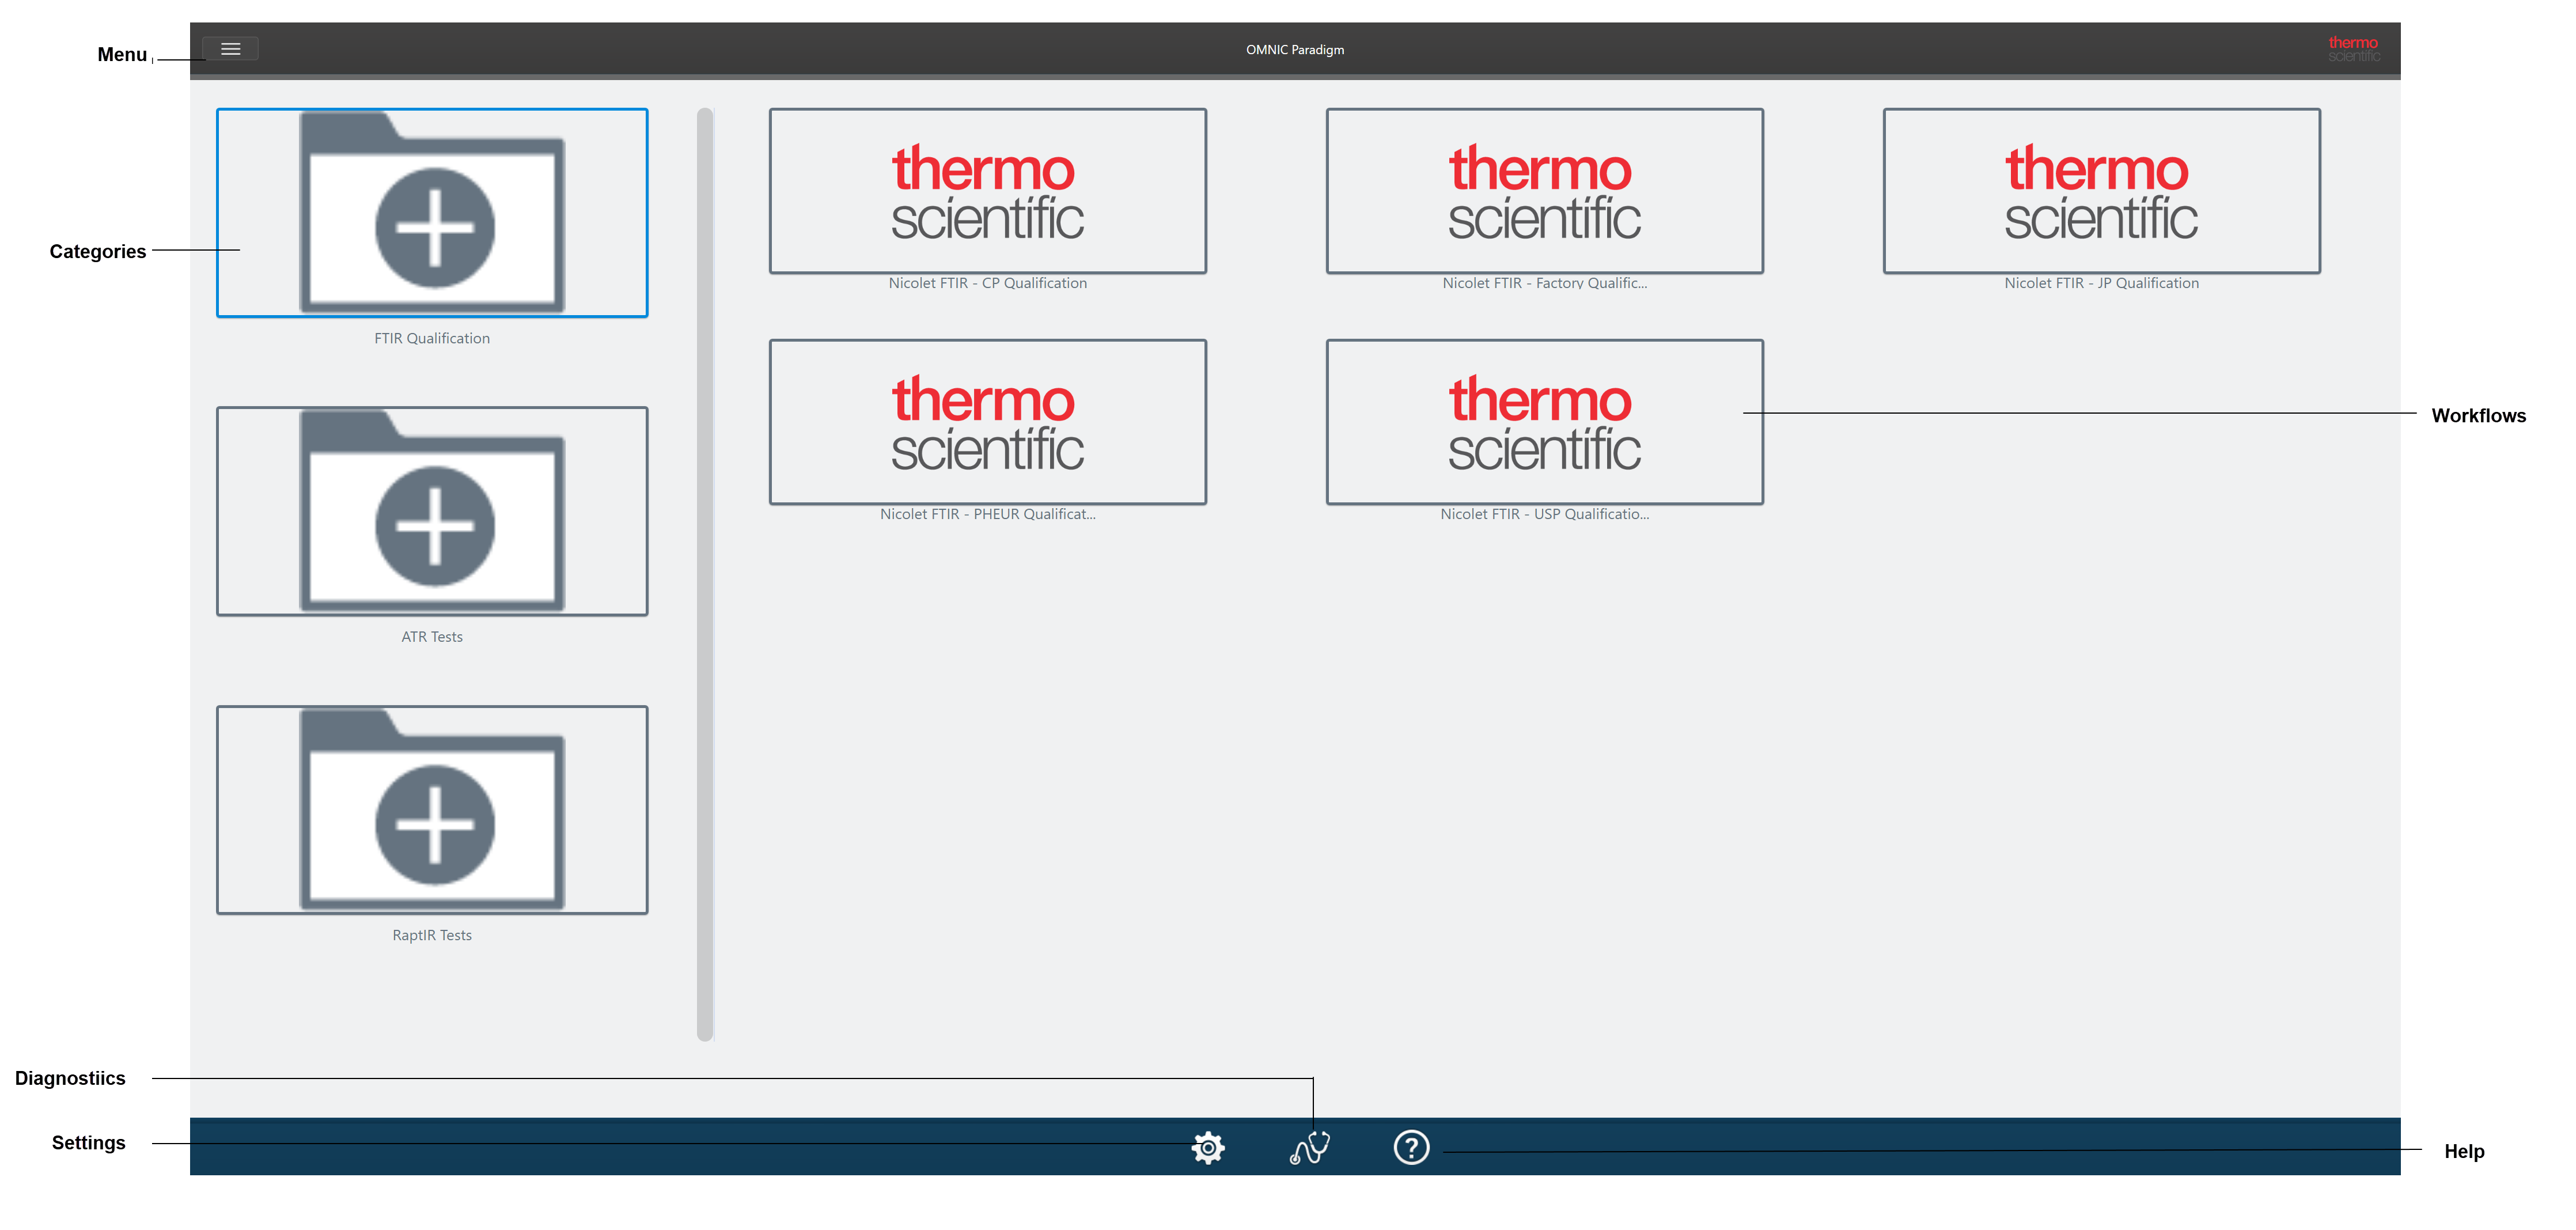
Operator View
In the Operator view, you see only the categories and workflows from packages that you have deployed. Explore Custom Solutions to learn more about creating packages and using the Operator view.
|
Component |
Description |
|---|---|
|
Menu |
The main menu. Use this menu to navigate to the Administrator view to import and deploy packages. |
|
Categories |
This area shows each of the categories that have been deployed. |
|
Diagnostics |
Select to view system status information or to align and calibrate the instrument.
|
|
Settings |
Select to view your database configuration, database options, and general software options. |
|
Workflows |
This area shows each of the workflows in this category. Select a workflow to run it. |
|
Help |
Opens the Thermo Fisher Scientific knowledge base, where you can find user guides and tutorials for your instruments and software.
|