Set OMNIC Paradigm Options
Use the Options dialog to customize the spectral display, to set the number of digits used for peak area, height, and location, and to configure automatic baseline correction.
The Options dialog

❖ To set and save OMNIC Paradigm options
- Open the Options dialog.
- Desktop interface: open the Configure menu and select Options.
- Touchscreen interface: Open the settings and navigate to the Options tab.
- Select New.
- Enter a name for the new options and click Save.
- Edit your settings.
- When you are finished editing settings, select Save to save your changes.
- Select Close to return to your previous screen.
Spectral display settings
The Spectral Display group is used to set the color and line weight of spectra in the Spectra view.
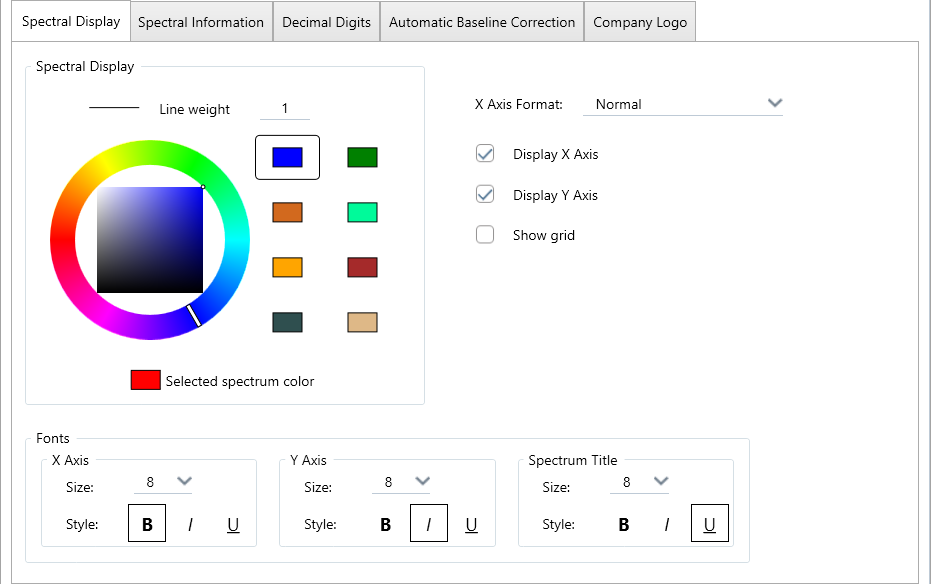
- Line Weight: Determines the thickness of the line used to draw the spectrum. Applies to all spectra shown in the Spectra view.
- Spectra colors: Set the colors used to display spectra.
- Selected Spectrum Color: Determines the color used to highlight the currently selected spectrum.
- Fonts: Control the size and style of fonts used for the x-axis, y-axis, and spectrum title.
-
X-axis format: Select Normal or Split2000.
You can change the x-axis format between normal or Split2000. In Split2000, spectra are displayed in wavenumbers, and the X-axis is split into two regions with a change of scale at 2000 wavenumbers (See the example below), with a vertical dashed line at the split. The scale of the region below 2000 wavenumbers is expanded by a factor of 2 as compared with the scale of the region above 2000 wavenumbers.
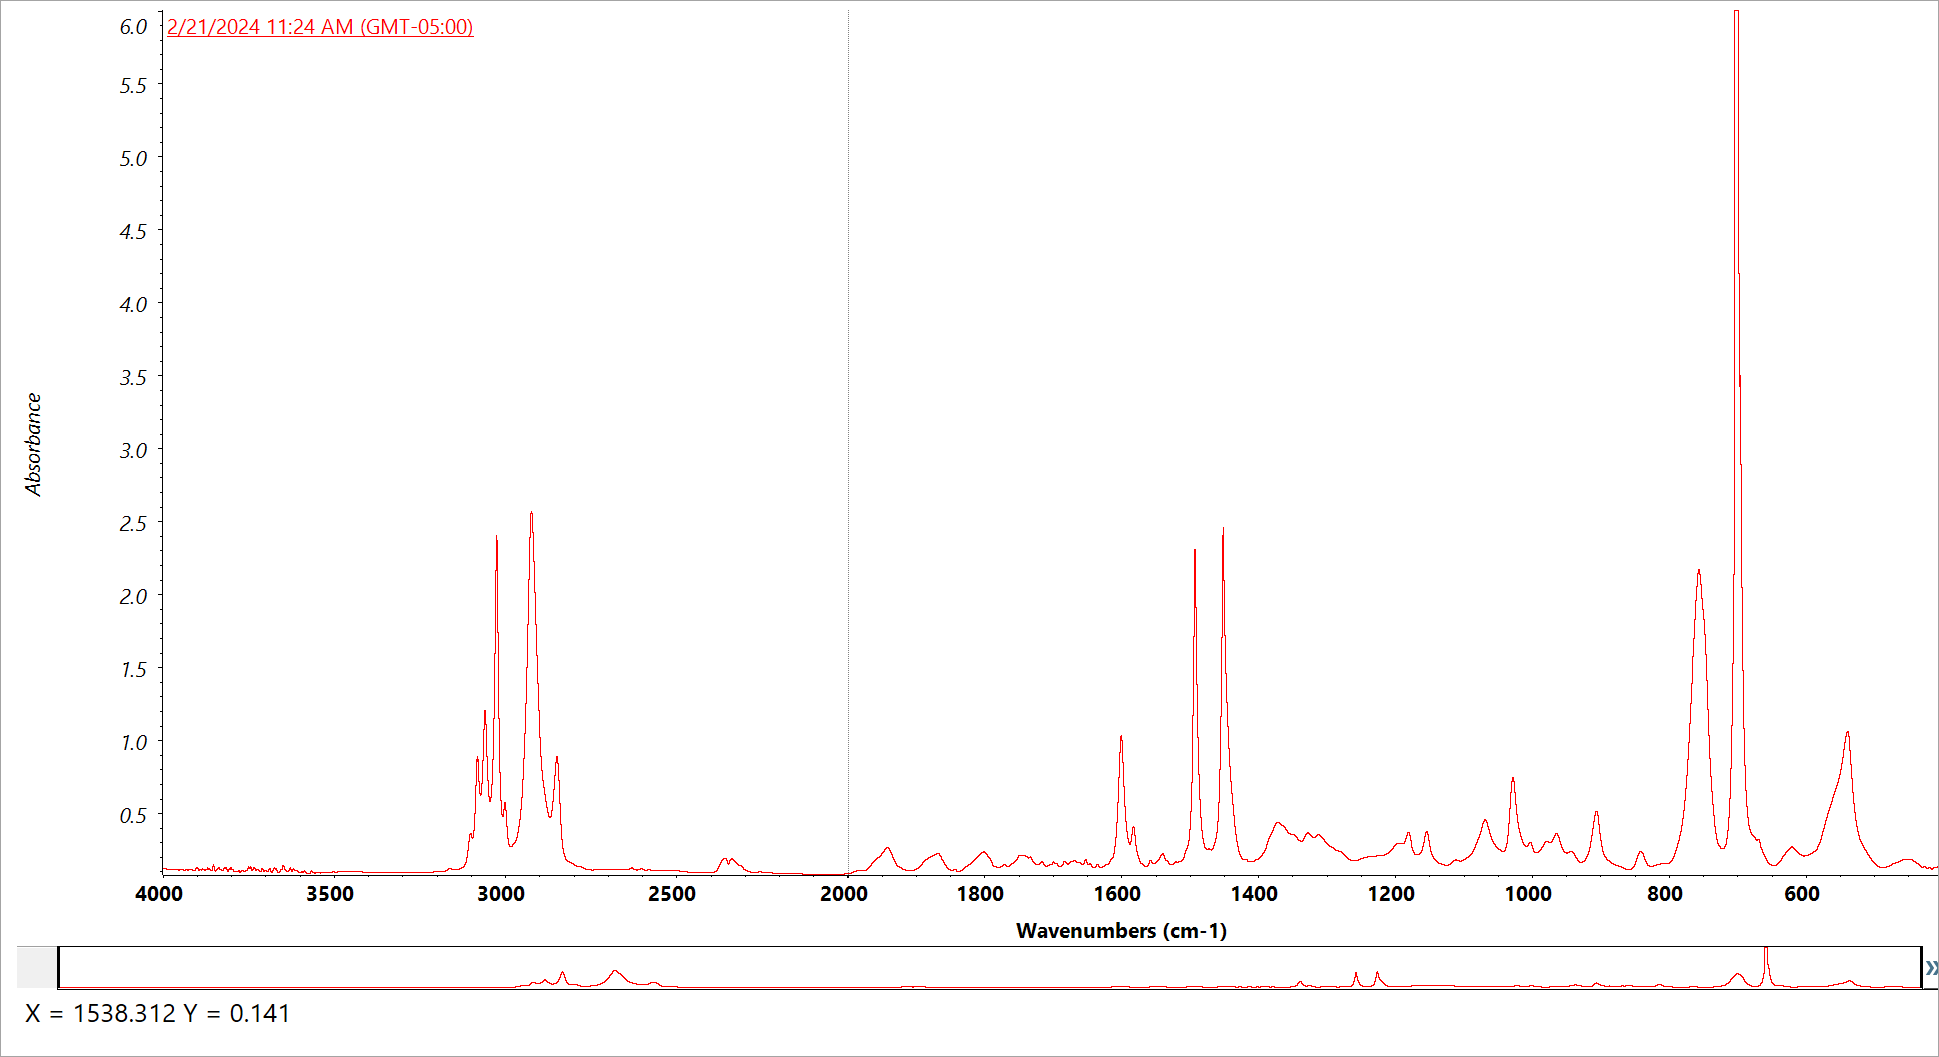
This format is useful for spectral interpretation. The region below 1,500 wavenumbers is the "fingerprint" region. Here you can find characteristic peaks that confirm your identification of the compound. Expanding this region with the Split2000 format makes it easier to view these peaks. This region is also where you can observe the spectral effects of molecular bending.
The region above 1,500 wavenumbers is called the "functional group region" and is where you can observe the effects of molecular vibrational stretching.
This format was commonly used in the past to display and plot data collected using dispersive spectrometers.
- Display x-axis: Show or hide the x-axis labels.
- Display y-axis: Show or hide the y-axis labels.
- Show grid: Selec to show a grid behind the spectra. This can make it easier to visually measure peaks. Note that the grid only displays along any axis that is showing. For example, if you turn off the x axis, the grid does not draw veritical lines along the x-axis.
Spectral information
Use these settings to automatically export spectra (SPA files) to a network or drive location and to set what information is displayed alongside the spectrum.

-
Export spectra automatically: Select this option to automatically export SPA files to a network or drive location. After selecting this option, browse to the location where the files will be saved.
-
Spectral information: Select these fields to show information on the spectral display. When these are enabled, the information also shows on the spectral image when you create a report.
You can also change these settings for individual tabs by opening the settings from right pane of a spectra tab.

Decimal digits
Use the Decimal Digits group to set the limit for the number of digits after the decimal separator. The limit is applied to the following:
- Peak area
- Peak height
- Peak location - X value
- Peak location - Y value
Note that this setting only applies to operations carried out after the setting is adjusted. Numbers in the spectrum information maintain the settings used at the time they were recorded and are not updated to reflect new settings. For example, if you carry out a find peaks operation with settings specifying 3 digits, the spectrum information shows 3 digits. If you then change your settings to use only 1 digit after the decimal, the spectrum information from the earlier find peaks operation will still show the 3 digits.
Automatic baseline correction
Use Automatic Baseline Correct in the Process menu to automatically correct tilted or curving baselines.
Set the polynomial order and number of iterations to specify the order of the equation and number of iterations to use for correcting baselines automatically.
Company logo
Use your own logo on reports and template reports. The image is shown on standard reports and reports you create using the Template Report tile in workflows.
Report images must be a PNG file and are automatically resized to be 120 px by 75 px.