Determining the Number of Center Pixels in Qtegra
Issue
Once an autopeak adjust has been performed, it is necessary to re-determine how many center pixels to use for the acquisition of the emission for the wavelength
Environment
- iCAP 6000 Series
- iCAP 7000 Series
- Qtegra
Resolution
1) Navigate to Intensities under Evaluation Results
2) Double-click on a cell for the intensity data of the standard you would like to use for determining the number of center pixels. Typically this will be the same standard used to autopeak adjust because it is at a sufficient concentration to work with.
3) The subarray window will now appear. Click on the maximize button to make this window bigger.
4) Right-click in the subarray window and deselect Smoothed Plot
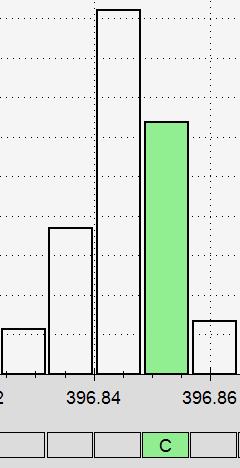
5) Find the most intense column in the subarray. It will be the largest bar graph located within the subarray. Reduce the number of center (‘C’) pixels to ‘1’ so that the only ‘C’ pixel enabled is the one directly under the most intense column.
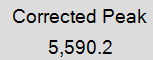
6) Record the Corrected Peak intensity
7) Now select only the center pixel under the next most intense column. It will be the pixel either to the left or the right of the most intense column.
8) Record the Corrected Peak intensity
9) If the corrected peak intensity recorded in step 9 is greater than 80% of the corrected peak intensity of the most intense column recorded in step 7 then use two pixels as the number of center pixels for integration
![]()
Otherwise use three pixels as the number of center pixels for integration
![]()
10) If changes were made to the number of center pixels, click “Apply Changes” in the Subarray window to save changes

11) Repeat steps 6-11 for each wavelength in your method
Analysis
Cause