Wavelength is Saturating in iTEVA
Issue
Wavelength is Saturating. Top of peak is missing or peak is missing altogether.
Environment
- iCAP 6000 Series
Resolution
1) With the subarray popup window open for the wavelength which is exhibiting a pseudo-saturation, increase the ‘C’ pixels to include the area under the peak (see Figure 2). Note: occasionally you might have to increase the subarray width greater than the default of 12 and turn off a Left or Right background correction point. In Figure 2, the Right background correction points had to be disabled due to it touching the center pixels after they were widened to 4 pixels.
![]()
Figure 2: Center pixels increased from 2 to 4 to totally encompass the peak
2) Click on “Update Method” to save these changes.
3) Aspirate a solution containing the element pertaining to the wavelength exhibiting pseudo-saturation and perform an Autopeak Adjust (If you are unsure of how to do this, please reference the Knowledge Article Perform Auto Peak in iTEVA for instructions on how to do so)
4) Using the same solution used to perform the autopeak adjust, run one repeat of an Unknown and then double click on the wavelength exhibiting pseudo-saturation in order to open up the subarray window
5) Optimize the number of center pixels and center pixel placement (The Knowledge Article Determining the Number of Center Pixels in iTEVA.pdf can be referenced for instructions on how to do so)
![]()
Figure 3: Center pixels have been optimized.
6) Click on “Update Method” to save changes
7) Repeat steps 1-6 for any other wavelengths which are also exhibiting pseudo-saturation.
Cause
Sometimes a peak will appear to be saturated in the subarray even though the amount of the element in the solution being analyzed should not cause the wavelength pertaining to that a element to be saturated (see Figure 1). This is what is referred to as a pseudo-saturation.
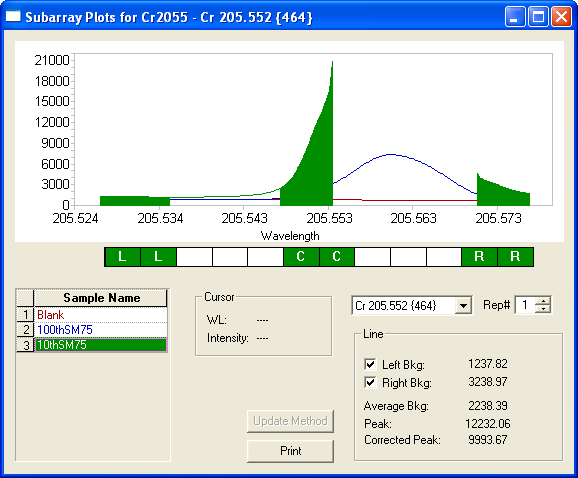
Figure 1: An apparent saturation of Cr 205.552
Attachment(s)
| File | Last Modified |
|---|---|
| Figure 3 - Center pixels have been optimized.png | December 08, 2022 |
| Figure 2 - Center pixels increased from 2 to 4 to totally encompass the peak.png | December 08, 2022 |
| Figure 1 - An apparent saturation of Cr 205.552.png | December 08, 2022 |