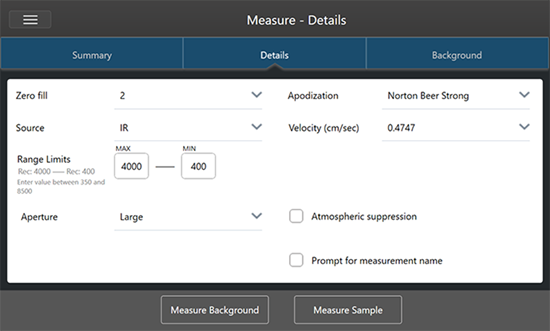
Advanced Measurement Options
Use advanced measurement settings to control apodization, zero fill, range limits, instrument-specific settings, and more.
These advanced settings should typically be left in their default state. Only in rare or specific circumstances should you edit these settings.
To review or edit advanced settings in the touchscreen interface, open the Details tab.
The Details tab displays advanced measurement settings.
To review or edit advanced settings in the desktop interface, click More in the New Measurement pane.
Advanced measurement settings are available from the dashboard
Advanced measurement settings
The following table describes each of the advanced settings.
|
Option |
Description |
Default Setting |
|
Detector |
The detector is a device inside the spectrometer that produces an electrical signal in response to the infrared beam striking it. The detector setting is updated automatically based on your spectrometer setup. Nicolet Summit: DTGS. Nicolet Summit Pro: TEC DTGS. |
|
|
Optical velocity |
Determines the optical velocity in the interferometer. The default value is determined by the type of detector you are using, and can only be changed on certain spectrometers. On the Nicolet Summit spectrometer, the default value is 0.4747 and cannot be changed. |
|
|
Zero fill |
Interpolates data points between the collected data points. This doesn’t increase the actual resolution of the data, but can smooth out sharp features and improve the line shape of a spectrum. Collect your sample and background spectra using the same Zero Fill setting. Options None: No zero filling is done. 1: One data point is added between each collected data point 2: Three data points are added between each collected data point |
2 |
|
Source |
The component inside the spectrometer that emits the infrared radiation that travels to the detector. The source type is determined by your spectrometer setup. See your spectrometer user guide for details on the source. |
|
|
Apodization |
Apodization refers to a mathematical function that is applied to the single beam data to reduce or remove peak side-lobes that can occur because the interferogram is not an infinite set of data. Strong apodization reduces more noise but can also reduce the resolution of the data and broaden peaks. You may want to consider weaker apodization, such as Boxcar, if you are measuring spectra with very narrow peaks, such as high-resolution gas spectra. See |
Norton-Beer Strong |
|
Automatic Atmospheric Suppression |
Suppresses the effects of water vapor and carbon dioxide on the spectra you have collected. In general, it is better to control for atmospheric conditions using a current background spectrum. If you measure the background frequently or if atmospheric conditions change slowly, there is no need to use this feature. Use this feature only if you measure the background infrequently or when atmospheric conditions change rapidly. |
Deselected |
|
Range Limits |
Sets the limits for the range of frequencies, in wavenumber, included in the collected spectrum. |
Max: 4,000 Min: 400 |
|
Aperture |
Controls the intensity of the infrared radiation that reaches the sample. Aperture can only be changed when using spectrometers with adjustable apertures. In general, larger apertures will result in a better signal-to-noise ratio while smaller apertures result in better stability and accuracy. Small apertures are better for high-resolution measurements. You may need to use small apertures to acquire true high-resolution spectra. |
|
|
Scan rejection and peak alignment |
During data acquisition, the data may naturally shift slightly. This setting tells the system whether and how to ignore, correct, or reject scans with shifted peaks.
|
Apodization functions
Apodization refers to a mathematical function that is applied to the single beam data to reduce or remove peak side-lobes that can occur because the interferogram is not an infinite set of data.
Strong apodization reduces more noise but can also reduce the resolution of the data and broaden peaks.
See FTIR Spectroscopy Academy for a general introduction to apodization. The following table describes the available apodization types:
|
Setting |
Description |
|
Boxcar |
The interferogram is unweighted; that is, the data are simply truncated at the beginning and end. Use this type when you are measuring a gas sample, want maximum resolution and are not concerned about ringing effects (side lobes). The greatest amount of ringing will be present with this type. |
|
Cosine |
This setting suppresses side lobes and only moderately degrades the resolution of the spectrum. This setting is similar to the Happ-Genzel and Norton-Beer medium apodization. Cosine is normally used only to reproduce the results of other experiments that used it. |
|
Happ-Genzel |
Suppresses side lobes more effectively than the Triangular type and with less reduction in resolution than that type. (It results in more reduction in resolution than the boxcar type.) |
|
Norton-Beer Weak |
This setting has a less pronounced smoothing effect on data than do the Norton-Beer Medium and Norton-Beer Strong types and degrades the resolution less than those types. Side lobes appear on both sides of peaks and are more pronounced for sharper peaks. Use this setting only when the best possible resolution is required. This setting is generally not recommended and is normally used only to reproduce the results of other experiments that used it. |
|
Norton-Beer Medium |
This type has a smoothing effect on data which is between that of the Norton-Beer Weak and Norton-Beer Strong types. It suppresses side lobes as much as possible given that it only moderately degrades the resolution of the spectrum. The side lobe suppression is more significant than for Norton-Beer Weak apodization. This setting is suitable for most normal samples; it gives results virtually identical to those obtained with Happ-Genzel. |
|
Norton-Beer Strong |
Norton-Beer Strong is the recommended apodization for the Nicolet Summit and Summit Pro spectrometers. This setting has a greater smoothing effect on data than do the Norton-Beer Weak and Norton-Beer Medium types and degrades the resolution of the spectrum more. The side-lobe suppression is more significant than for Norton-Beer Medium apodization. |
|
Triangular |
Mathematically weights interferogram data to reduce ringing effects (side lobes), resulting in lower resolution than that obtained with the boxcar and Happ-Genzel types. Some ringing will usually be present with this type. This setting is normally used only to reproduce the results of other experiments that used it. |
|
Blackman-Harris |
The 4-term Blackman-Harris function is a strong apodization function that is better than any of the others at suppressing side lobes. However, it results in greater line broadening than any of the others. In practice this has the effect of reducing random noise in a spectrum while causing band broadening. |