Find Peaks
Use Find Peaks in the Identify menu to identify peak locations in a spectrum. The command finds peaks in the displayed spectral region or in the selected region if you have selected one.
The command searches for peaks with Y-values above a threshold and then labels them with their X-values.
To find peaks
-
Starting in the Spectra view, select a spectrum.
-
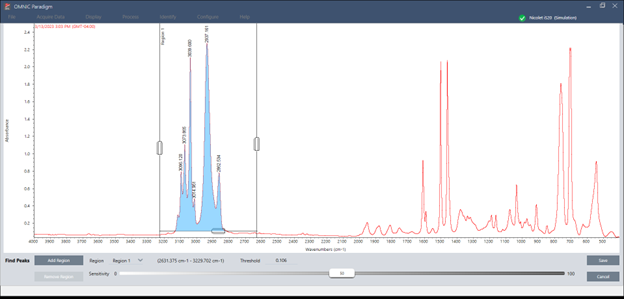
Go to the Identify menu and select Find Peaks. You can also use the CTRL+K keyboard shortcut. The Find Peaks view opens.
-
Adjust the region, threshold, and sensitivity to your liking. The display shows you the peaks found with the current settings. You can add multiple regions or include the entire range.
-
Click Save. The peaks are annotated on the spectrum, and you can now create a Peak Results report, which includes all the found peak locations.
| Setting | Description |
|---|---|
| Region |
Indicates the region in which the tool will find peaks. |
| Threshold |
The Find Peaks tool identifies peaks found above this Y-axis limit. If the Y-axis format of the spectrum produces downward pointing peaks, the peaks that extend below the threshold will be found. For example, if the threshold value is 0.5, peaks in the selected spectral region whose Y value is greater than or equal to 0.5 will be found and labeled |
| Sensitivity |
The sensitivity determines how readily Find Peaks finds shoulders on peaks and small peaks in the baseline. Unlike the threshold value, which merely specifies the Y value above which peaks are found, sensitivity considers the relative size of adjacent spectral features. If you use a low sensitivity setting, a shoulder is treated as part of the larger peak and a small peak is treated as part of the noise in the baseline; neither feature will be found. At a higher sensitivity setting, the shoulder and small peak will be found and labeled as peaks. If the sensitivity is set too high, noise and other unimportant features above the threshold will be found along with the useful features. Use a combination of threshold and sensitivity settings that lets you find just the spectral features you are interested in. |